
Quick Take
In the last 2 trading days, as US President Trump's patience worn thin on China, which led to the announcement of further tariffs by Sept 1, the market is behaving as if both sides are moving closer to a full-blown trade crisis where the favorite trade, for now, has been to bid the Yen and the Swissy to the boots. Flows hitting the USD and the EUR saw a rather neutral performance of the respective indices, with both currencies suffering from its own demerits as the knock-on effect of a protracted trade war means the ECB and the Fed look poised to stick to their easing paths (QE II + rate cut by the ECB, back-to-back rate cut by the Fed). But it's not only the Fed or the ECB, the pathetic performance by the AUD or NZD, other than the influence risk-off has had, also tells us the RBA and the RBNZ will be forced to flex their muscles by further adjusting policy into an easier mode as we head into Sept/Oct. The RBNZ meets this week, and with such a dicey environment, a dovish outcome looks highly likely. In terms of the CAD and GBP indices, the former looks still quite constructive as the BOC has not been as explicit in its dovish bias compared to the rest of Central Bank, while we all know that GBP and the BoE continue to be in a hostage situation due to the political process of Brexit. As a full-blown trade war is an event being currently discounted, it revitalizes the central thematic that it really is a race to the bottom in the currency market as Central Bank are forced to ease, which leads to flows headed into old school plays by backing the safe-haven status of the Yen and Swissy as global yields implode discounting gloomy times ahead.
Narratives In Financial Markets
* The Information is gathered after scanning top publications including the FT, WSJ, Reuters, Bloomberg, ForexLive, Institutional Bank Research reports.
Markets on the defensive: Amid the sudden escalation in the US-China trade war after Trump’s fresh 10% tariffs announcement last Thursday, the environment clearly remains to play defensive with derisking off leveraged positions still the name of the game as further negative-charged headlines on trade are likely to hit the market sentiment. Hu Xijin, Global Times editor and China’s government mouthpiece, notes that “Beijing was very disappointed with the latest flip-flops of the US”, adding that “it's understood Chinese side always has a plan B, which includes a series of countermeasures” via a well-informed official on condition of anonymity.
Game of hardball 'ON': Signs that China is not going to budge by the latest threat by Trump keep emerging as the press is reporting that China is turning to Brazil to double down on soybeans purchases. It means that the game of hardball keeps going and with the truce essentially dead in the water, this may have been the final straw for markets to really assume this trade war is here to stay for the long run, with no end in sight during the Trump’s administration. Bad for risk and the global economy.
Trump throws fuel to the fire: Speaking at a rally in Cincinnati, Ohio, President Trump told those attending that “we will be taxing the hell out of China.” Again, the threats by Trump run the risk of exhausting the patience of China, which bring us closer to a full-blown trade war. If that’s the case, the central thematic of buying risk on the belief that Central Banks will come to the rescue with further rounds of QE may no longer cut it as the market prices in protracted recessionary pressures globally, even if still not reflected in the US data.
China set to retaliate: The type of action the market is expecting from China to retaliate against the US may include the announcement of an unreliable entity list, which would exclude some US companies from doing business in mainland China. To prohibit exporting "rare-earth" materials to US/US companies. Additionally, to increase tariffs on US goods. China may take a gradual approach applying these methods of taxation in a gradual manner vs all at once.
USD/CNH breaks 7.00: The PBOC got the ball rolling by setting today's fixing above 6.9 for the first time this year, while the market finally pushed it past 7.00. What's important now is whether or not the PBOC lets the rate stay above this psychological area. One thing is clear. You don't see these overstretched moves in the Yen, Yuan or Swissy unless the market is freaking out by discounting a major event, which top of the mind for everyone is a full-blown trade war. The market has come to grips that the truce isn't working, so the next logical move might be to cancel further talks and declare the full-blown stage until the next US presidential election. The markets are behaving as if this is the central case otherwise u don't see these moves. But again, the market may be getting ahead of itself.
US NFP a side-show eclipsed by trade: US July NFP headline number came bang on expectations at +164K vs +165K expected, with a slight uptick in the jobless rate at 3.7% vs 3.6% expected as participation rate went up by a 0.1% margin to 63.0% vs 62.9% prior. The average hourly earnings edged up to +0.3% vs +0.2% exp on a monthly basis, which puts the yearly reading at +3.2% y/y vs +3.1% exp. The positives and negatives in the US NFP canceled each other out for a rather neutral read overall. However, with the trade war clearly on the driving seat, this month’s US NFP will be mostly sidelined as a factor to influence the pricing of assets.
New insights by Fed dissenters: Fed's Boston Rosengren and Fed's Kansas, who were the two dissenters not supporting a 25bp rate cut in last week’s FOMC meeting, made public appearances to update markets on their stance on monetary policy. George said that a clear and compelling case to ease is not in place given the strong domestic economic data, reduced cost of credit/vol and stocks at all-time highs. George’s neutral view is also anchored by the economic health seen in the US indicators, even if she made the admission that she is ready to back adjusting policy if data warrants it, also recognizing that the outlook including trade and global growth poses clear risks.
Recent Economic Indicators & Events Ahead
We have bank holidays both in Australia and Canada today, which will reduce liquidity in forex. In terms of data to watch out for, the only high-impact event to monitor during the course of Monday includes the US ISM Non-Manuf PMI, which is expected to come a tad better.
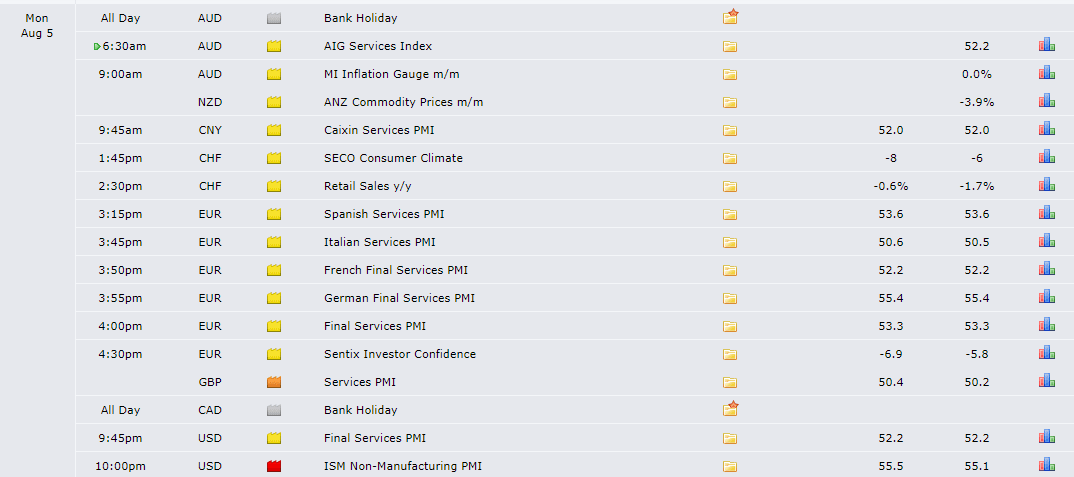
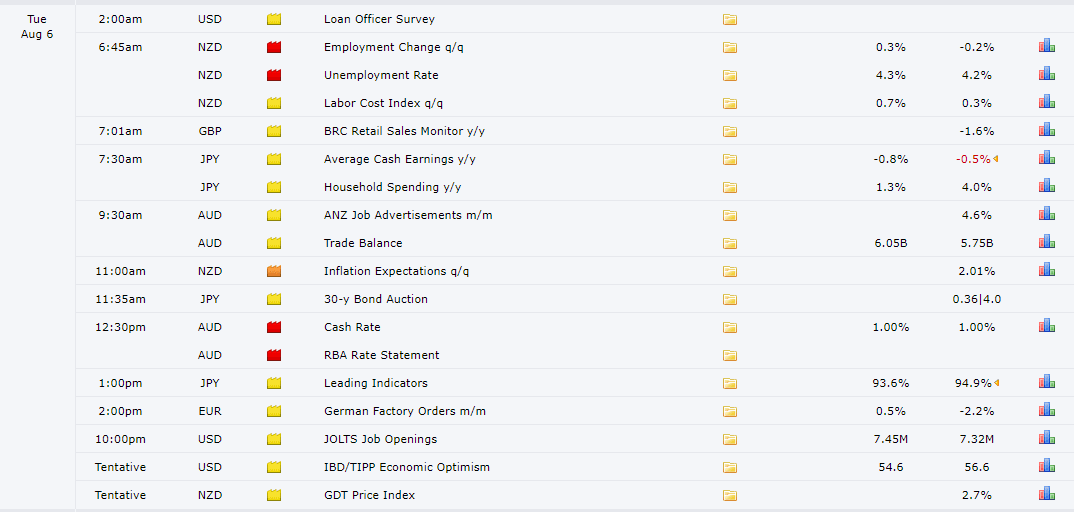
Source: Forexfactory
A Dive Into The Charts
The overstretched nature of the movements seen in the JPY or CHF as a full-blown trade war between the US and China is priced in makes the current pricing of these currencies rather unsustainable unless backed by further negative headlines this Monday. It’s always telling to see both the Yen and the Swissy fly in sync as it indicates the market is really freaking out that this time we could be on the edge before the US and China officially give up on further trade talks. As a result, the Oceanic currencies have gone through an absolute bloodbath and the closes by NY business hours on Friday are far from encouraging. The Euro and the USD, as the two most highly liquid currencies, continue to experience a more moderate fluctuation, even if the mood in the market for the last 2 days has been to punish the USD (in the context of an uptrend) as the chances of further rate hikes by the Fed in Sept are almost fully priced in again. The Pound is another currency in a well-established downtrend due to a hard-Brexit scenario even if the currency is showing more resilience in the last 4 days of trading. Lastly, the CAD index, after the rejection off its baseline (13-d ema), looks to offer attractive levels to engage in longs.
The first market I want to revisit in today’s note is the CHF/JPY as the confluent area of support I highlighted on Friday just ahead of 108.00 has found a sufficient demand imbalance to see a decent bounce. Remember, this is a reversal to the mean trade with a great deal of confluence to act as an area where market makers and sellers taking profits will apply enough pressure to increase the odds of a rebound significantly based on the concept of the 100% proj target.
Another market, akin to the CHFJPY, that reaches its 100% projected target only to see a turnaround as offers built up there is the USD/SEK. Again, it coincided with a round number 9.70, a horizontal resistance and a 100% proj target all meeting in the same area.
Talking about 100% proj targets. There will be times when the supply or demand imbalance is so one-sided that market makers and other participants/algos will pull their orders or won’t be sizeable enough to absorb the directional pressure, in which case, these breached proj targets tend to then act as the immediate area of support or resistance on a retest. This is something we’ve recently seen in markets such as the GBP/CHF or GBP/USD. Judge by yourself.
A second market that looks rather fragile for further sell-side follow-through is Oil, which I did point at it in my last note too, saying that any rebound towards 56.00 is likely to see sellers re-group for a potential extension lower into the 54.00 where a reassessment will be needed. The risk-averse conditions coupled with the pricing of greater risks of a global slowdown won’t do any favor for the outlook of Crude Oil as market participants forebode weaker demand.
The S&P 500, which provided a huge warning that further selling the next day was a real possibility, has also found enough of an imbalance in supply to extend its downside. Not often we get clues via price action in the daily this clear, with a reversed pin bar with huge volume breaking through and closing past a key level of support. Whoever is a buyer, will have serious reservation engaging in business with any type of conviction until the level of support at 2,920 or thereabouts, which is precisely the area I mentioned as the next target in Friday’s note, and the actual target that was reached by sellers before a rebound in price worth over 10p.
Important Footnotes
- Risk model: The fact that financial markets have become so intertwined and dynamic makes it essential to stay constantly in tune with market conditions and adapt to new environments. This prop model will assist you to gauge the context that you are trading so that you can significantly reduce the downside risks. To understand the principles applied in the assessment of this model, refer to the tutorial How to Unpack Risk Sentiment Profiles
- Cycles: Markets evolve in cycles followed by a period of distribution and/or accumulation. To understand the principles applied in the assessment of cycles, refer to the tutorial How To Read Market Structures In Forex
- POC: It refers to the point of control. It represents the areas of most interest by trading volume and should act as walls of bids/offers that may result in price reversals. The volume profile analysis tracks trading activity over a specified time period at specified price levels. The study reveals the constant evolution of the market auction process. If you wish to find out more about the importance of the POC, refer to the tutorial How to Read Volume Profile Structures
- Tick Volume: Price updates activity provides great insights into the actual buy or sell-side commitment to be engaged into a specific directional movement. Studies validate that price updates (tick volume) are highly correlated to actual traded volume, with the correlation being very high, when looking at hourly data. If you wish to find out more about the importance tick volume, refer to the tutorial on Why Is Tick Volume Important To Monitor?
- Horizontal Support/Resistance: Unlike levels of dynamic support or resistance or more subjective measurements such as fibonacci retracements, pivot points, trendlines, or other forms of reactive areas, the horizontal lines of support and resistance are universal concepts used by the majority of market participants. It, therefore, makes the areas the most widely followed and relevant to monitor. The Ultimate Guide To Identify Areas Of High Interest In Any Market
- Trendlines: Besides the horizontal lines, trendlines are helpful as a visual representation of the trend. The trendlines are drawn respecting a series of rules that determine the validation of a new cycle being created. Therefore, these trendline drawn in the chart hinge to a certain interpretation of market structures.
- Correlations: Each forex pair has a series of highly correlated assets to assess valuations. This type of study is called inter-market analysis and it involves scoping out anomalies in the ever-evolving global interconnectivity between equities, bonds, currencies, and commodities. If you would like to understand more about this concept, refer to the tutorial How Divergence In Correlated Assets Can Help You Add An Edge.
- Fundamentals: It’s important to highlight that the daily market outlook provided in this report is subject to the impact of the fundamental news. Any unexpected news may cause the price to behave erratically in the short term.
- Projection Targets: The usefulness of the 100% projection resides in the symmetry and harmonic relationships of market cycles. By drawing a 100% projection, you can anticipate the area in the chart where some type of pause and potential reversals in price is likely to occur, due to 1. The side in control of the cycle takes profits 2. Counter-trend positions are added by contrarian players 3. These are price points where limit orders are set by market-makers. You can find out more by reading the tutorial on The Magical 100% Fibonacci Projection