Get 40% Off
🚨 Volatile Markets? Find Hidden Gems for Serious Outperformance
Find Stocks Now

Bitcoin Chart: Textbook Example Of Support Turned Resistance

Published 07/20/2018, 12:55 AM
Updated 07/09/2023, 06:31 AM

Although I’ve never owned a penny of any cryptocurrency, I find their charts fascinating. They are much better-behaved than equities these days...maybe because they are actually – gasp – permitted to go up and down based on natural economic laws instead of trillions of dollars of distortion.

Anyway, Bitcoin is the king of them all, and its chart is particularly intriguing. It broken its symmetric triangle (red circle below) and ground down to under $6000, having peaked at almost $20,000 last December. However, it rallied mightily up to, yep, just underneath that broken trendline. Here we see a textbook example of support magically changing roles to resistance.
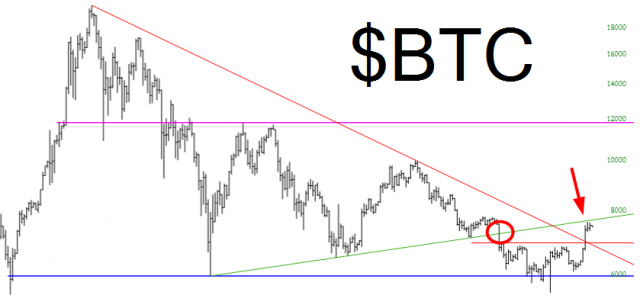
BTC Chart

Looking much closer, you can see how a small bullish base was formed, and a few days ago the crypto space exploded higher. It was a one-hit wonder, however, and unless $BTC conquers that trendline, it is at risk of continuing to erode in the weeks and months ahead.
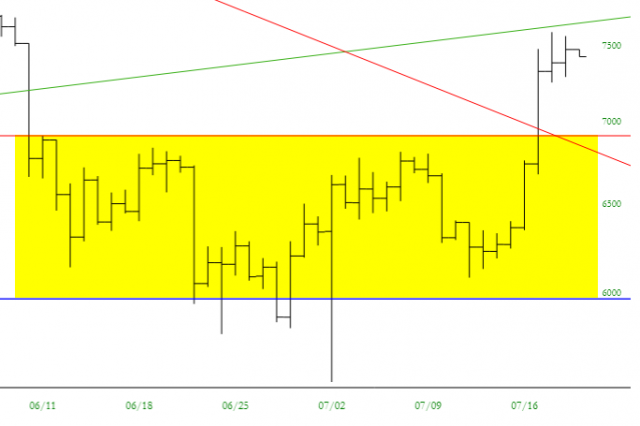
Crypto

Latest comments

Please analysis the altcoins like lisk ,ark ,kmd ,stratis... thanks
Risk Disclosure: Trading in financial instruments and/or cryptocurrencies involves high risks including the risk of losing some, or all, of your investment amount, and may not be suitable for all investors. Prices of cryptocurrencies are extremely volatile and may be affected by external factors such as financial, regulatory or political events. Trading on margin increases the financial risks.
Before deciding to trade in financial instrument or cryptocurrencies you should be fully informed of the risks and costs associated with trading the financial markets, carefully consider your investment objectives, level of experience, and risk appetite, and seek professional advice where needed.
Fusion Media would like to remind you that the data contained in this website is not necessarily real-time nor accurate. The data and prices on the website are not necessarily provided by any market or exchange, but may be provided by market makers, and so prices may not be accurate and may differ from the actual price at any given market, meaning prices are indicative and not appropriate for trading purposes. Fusion Media and any provider of the data contained in this website will not accept liability for any loss or damage as a result of your trading, or your reliance on the information contained within this website.
It is prohibited to use, store, reproduce, display, modify, transmit or distribute the data contained in this website without the explicit prior written permission of Fusion Media and/or the data provider. All intellectual property rights are reserved by the providers and/or the exchange providing the data contained in this website.
Fusion Media may be compensated by the advertisers that appear on the website, based on your interaction with the advertisements or advertisers.
© 2007-2024 - Fusion Media Limited. All Rights Reserved.