One of the first mistakes many new traders make when using technical analysis surrounds the words ‘overbought’ and ‘oversold.’ While the Relative Strength Index (RSI) is one of the most popular technical indicators, it’s often used incorrectly. Stocks and markets that become ‘overbought’ or ‘oversold’ can often become more overbought and oversold.
The Mean-Reverting Indicator
While this applies to many momentum indicators, I’m going to focus this discussion on the RSI. Momentum is often thought of as a mean-reverting indicator. It’s believed that something cannot rise or fall forever and the momentum of the trend will likely correct itself. While 70 and 30 are often the ‘trigger’ lines for the idea of being ‘overbought’ and ‘oversold’ respectively, this ignores the whole notion of momentum.
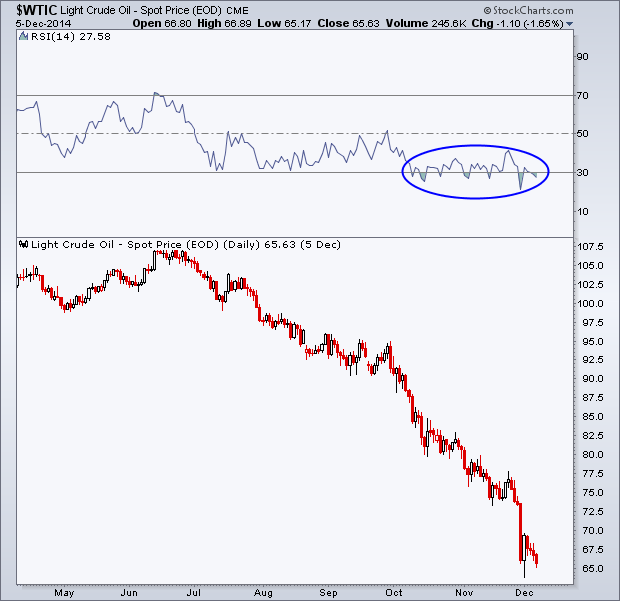
A break above these numerical levels just tell us how strong or weak momentum actually is. It does not mean momentum nor the RSI indicator has to revert. This is why I often look for bullish or bearish divergences as signs of changing momentum. Which involves price continuing a trend after a brief decline but does not receive confirmation in momentum as the indicator begins to diverge and change direction. The chart of Crude Oil does a great job at showing why a break outside an ‘overbought’ or ‘oversold’ level is not good enough to forecast a change in trend.
Oil saw its first reading under 30 on October 9 on the daily chart and while the next day the price of Crude rose, it did not put a stop to the selling within this commodity. However, it did tell us how weak momentum was and the price of a barrel of crude oil has continued to fall over 20% since then. During this time the RSI indicator has broken under the ‘oversold’ level six additional times. Sellers have been relentless in pushing oil prices lower and momentum has shown us this by staying consistently weak.
The Exception
One caveat to the idea that being ‘oversold’ or ‘overbought’ in momentum is not good enough to begin expecting a change in trend is the time frame. The above example in Crude Oil is a daily chart but there can sometimes be interesting setups in a weekly or monthly chart when momentum gets extended in one direction and quickly reverses course. This is not to say that when coupled with other forms of analysis that over-extended momentum can not be a good tool. But by itself, in my opinion, it is often signaling the opposite of what many traders believe and the trend in price continues.
Disclaimer: Do not construe anything written in this post or this blog in its entirety as a recommendation, research, or an offer to buy or sell any securities. Everything in this post is meant for educational and entertainment purposes only. I or my affiliates may hold positions in securities mentioned in the blog. Please see my Disclosure page for full disclaimer. Connect with Andrew on Google+, Twitter, and StockTwits.

