Crude Oil WTI, short term view
Let us trace recent moves on crude oil WTI and make some assumptions of its future steps. In this issue we deal with a short term view for oil, look for a long term picture in our next issues.
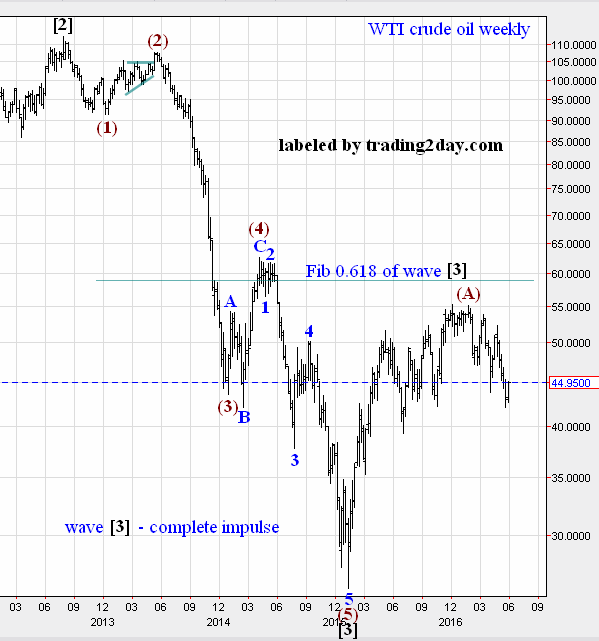
The last impulsive wave in its complete state is on the chart above. The move has already ended and an upward correction in wave [4] is unfolding. Fibonacci level 0.618 of wave [3] length and the top of previous wave (4) offer a good target space for a next wave [4]. As we can see upward move has already touched this target space. This move has already made minimal requirements for wave [4] in time and length, and we could carefully say, that a move down is very probable now, either wave [5] is already running, or any downward step in wave [4] is unfolding.
To say more clearly: “Any pullback toward Fibonacci level 0.618 of wave [3] length is a good place to SELL”. This short position could be held until the end of wave [5].
It is totally impossible to hold a long term short position on OIL using CFD (contract for price difference), swap rates clearly push you to day trading. It would be good to find some appropriate ETF (exchange traded fund) tool or oil futures-options for a long term position. This tool should have a low swap rate or low extra charges and a good liquidity.
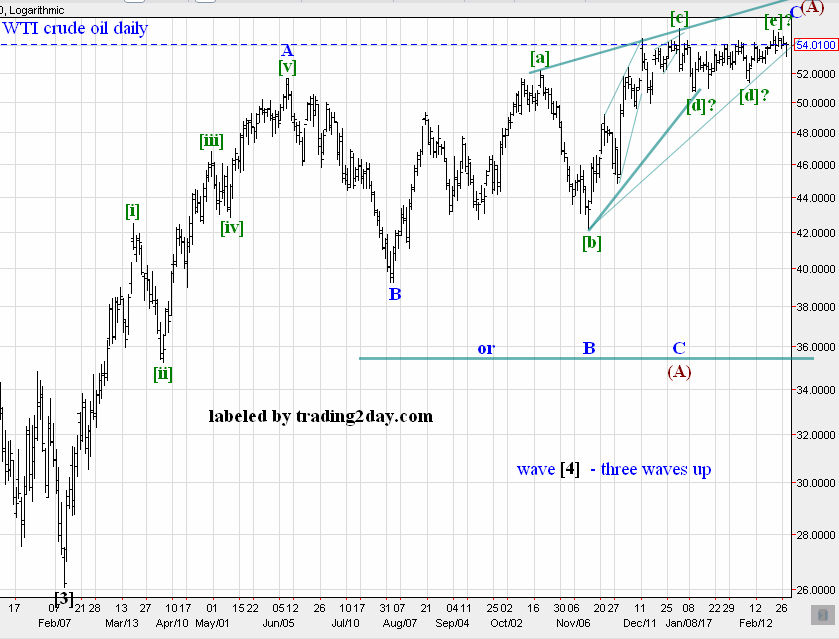
Wave [4]. Until now we see three waves up. First wave can be strictly counted as a five wave impulse, but the ending wave is not obvious. The main problem is where the end of wave B?
We present two possible ways, and both ways count first move in wave [4] as three waves:
1) wave C is an ending triangle with a short last wave;
2) wave C is a five waves impulse.
First move up has a complete form, has climbed into our target space. We wait for a move down. This move can be
1) next wave in a triangular wave [4],
2) wave (B) in a flat correction (A)-(B)-(C),
3) wave [5] itself, yes, wave [4] maybe already over.
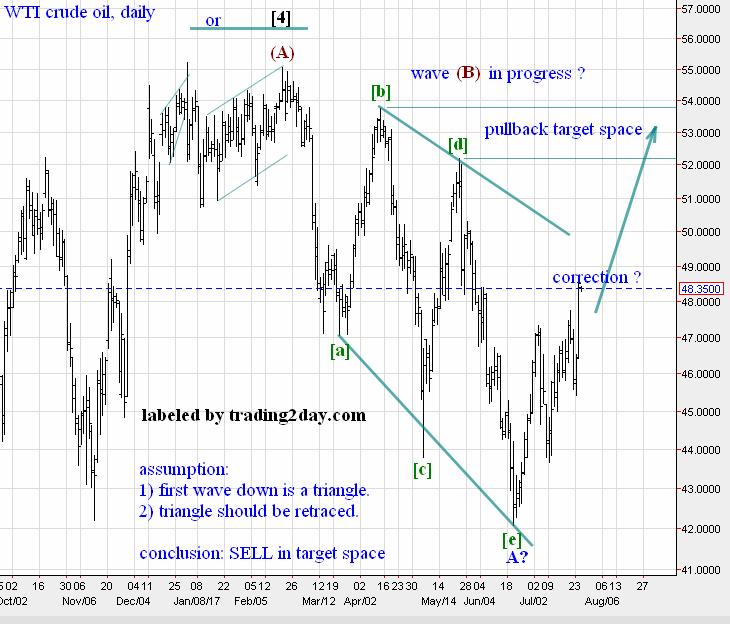
Taking into account above mentioned variants, we have these thoughts:
1) recently achieved top in wave [4] was a good place to open long term SELL position;
2) currently oil is in a short term downward move, it is either wave [5] or any downward wave
inside wave [4];
3) first wave down may be an initial triangle, we can wait for a high pullback;
4) the end of a high correction could be a place to SELL oil.
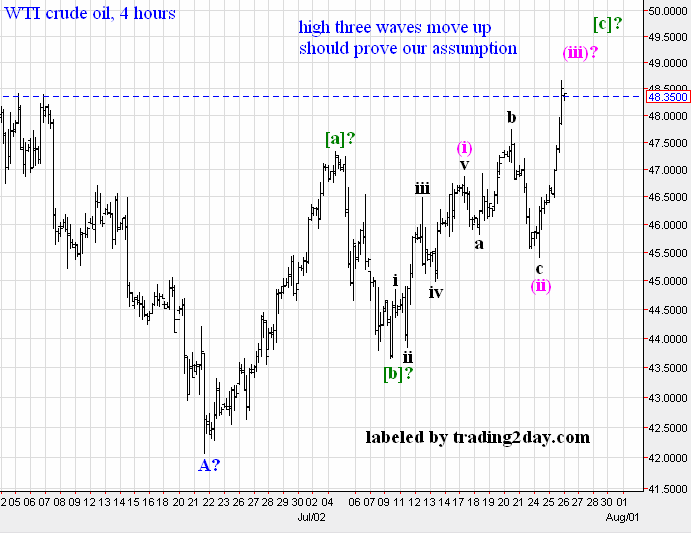
So, we wait for a high correctional upward move in three waves. It would be much better, if this move enters our pullback target space. At the end of pullback we may SELL oil using any appropriate ETF, futures and so on. Due to some uncertainty we could partially close this SELL near the bottom of wave [3], because current fall maybe wave (B) of a flat surface. About of 2/3 of SELL position should be closed near the wave [3] bottom to avoid any risk. But we note, that wave [5] should start anyway, and price will eventually drop below existing bottom of wave
[3], and any SELL inside wave [4] space will eventually bring some profit.
Disclosure: None of the information or opinions expressed in this blog constitutes a solicitation for the purchase or sale of any security or other instrument. Nothing in this article constitutes investment advice and any recommendations that June be contained herein have not been based upon a consideration of the investment objectives, financial situation or particular needs of any specific recipient. Any purchase or sale activity in any securities or other instrument should be based upon your own analysis and conclusions.
All my market opinions reflect my own trading behavior, this behavior is based on Elliott waves law. My opinion can not be considered as an investment advice and may or may not match with market opinions of other trading2day.com authors.
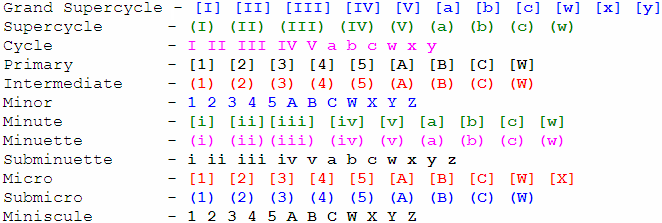
Waves labels table. Degree of our waves on charts may or may not match with yours, it is not an error.
Virgin space on our charts is the place in impulse, with no overlaps. This space could serve as a support-resistance level or a target for a next high degree wave. Usually arises in the third wave of the third wave – the middle of the middle.
