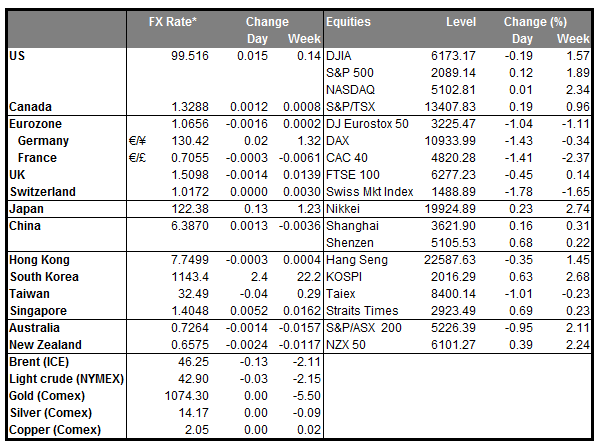
• Crude oil price falls to a seven year low After crude oil peaked at almost $108/barrel in 2014, a massive increase in global production has led prices to currently trade at $40/barrel. The recent excess in supply started pushing prices down in May, following a move from OPEC to protect its market share against new and cheaper techniques to extract oil, such as fracking. The latest dip to $40 however, came as a result of the OPEC decision last week, in which they refused to decrease production, a move that would have driven oil prices up again. Countries such as Canada, the world’s fifth largest oil producer, have experienced large losses in their oil industries, which could be translated to spillover effects in the rest of the economy as jobs are eliminated. We remain bearish on CAD.
• PBoC guides yuan to its lowest level since 2011 ahead of FOMC meeting The Chinese central bank has reduced the yuan’s fixing, which restricts the onshore currency’s moves to 2% on each side, by 0.1 percent. The nation’s authorities are apparently conducting a currency “stress test,” prior to the Fed meeting next week. The move was perhaps motivated by expectations that after a FOMC rate hike, China and most other emerging economies will see a huge increase in capital outflows, or due to the softness in the economy partly reflected in November’s inflation data. A weaker yuan would also help the country’s exports, which continue to decline.
• Overnight: The Chinese CPI and PPI data for November showed that while consumer prices accelerated slightly, producers’ prices fell at the same pace as the previous month which is the worst since the global financial crisis. Bearing in mind that both imports and exports have continued to decline in November, many expect that the Chinese economy will print its slowest expansion in Q4 for a quarter of a century. In an attempt to jump start the sluggish economy, the PBoC has already cut interest rates six times since last November and lowered the banks’ reserve ratios, while the government has introduced a series of reforms to boost domestic demand. The weak inflation data could reinforce expectations for the central bank to release more stimulus in the coming months.
• Today’s highlights: The Reserve Bank of New Zealand holds its monetary policy meeting. Although the Bank left the rate unchanged in October, it warned that it may need to cut rates in the future to offset the deflationary impact of the stronger currency. Followings signs that inflationary pressures have slowed somewhat, and given the NZD has been appreciating recently, expectations are for a 25bps rate cut, which could put downward pressure on the kiwi. However, the magnitude of the impact could depend not just on the decision itself, but also on the statement accompanying the decision. A possible rate cut may have a somewhat muted effect on the kiwi if the bank signals that this is the end of this easing cycle.
• As for indicators: From Europe, Germany’s trade surplus increased by more than expected in October, while in the US, wholesale inventories for the same month are forecast to have slowed.
• We only have one speaker on Wednesday’s agenda: ECB Executive Board member Sabine Lautenschlaeger.
The Market
EUR/USD pokes its nose above 1.0900
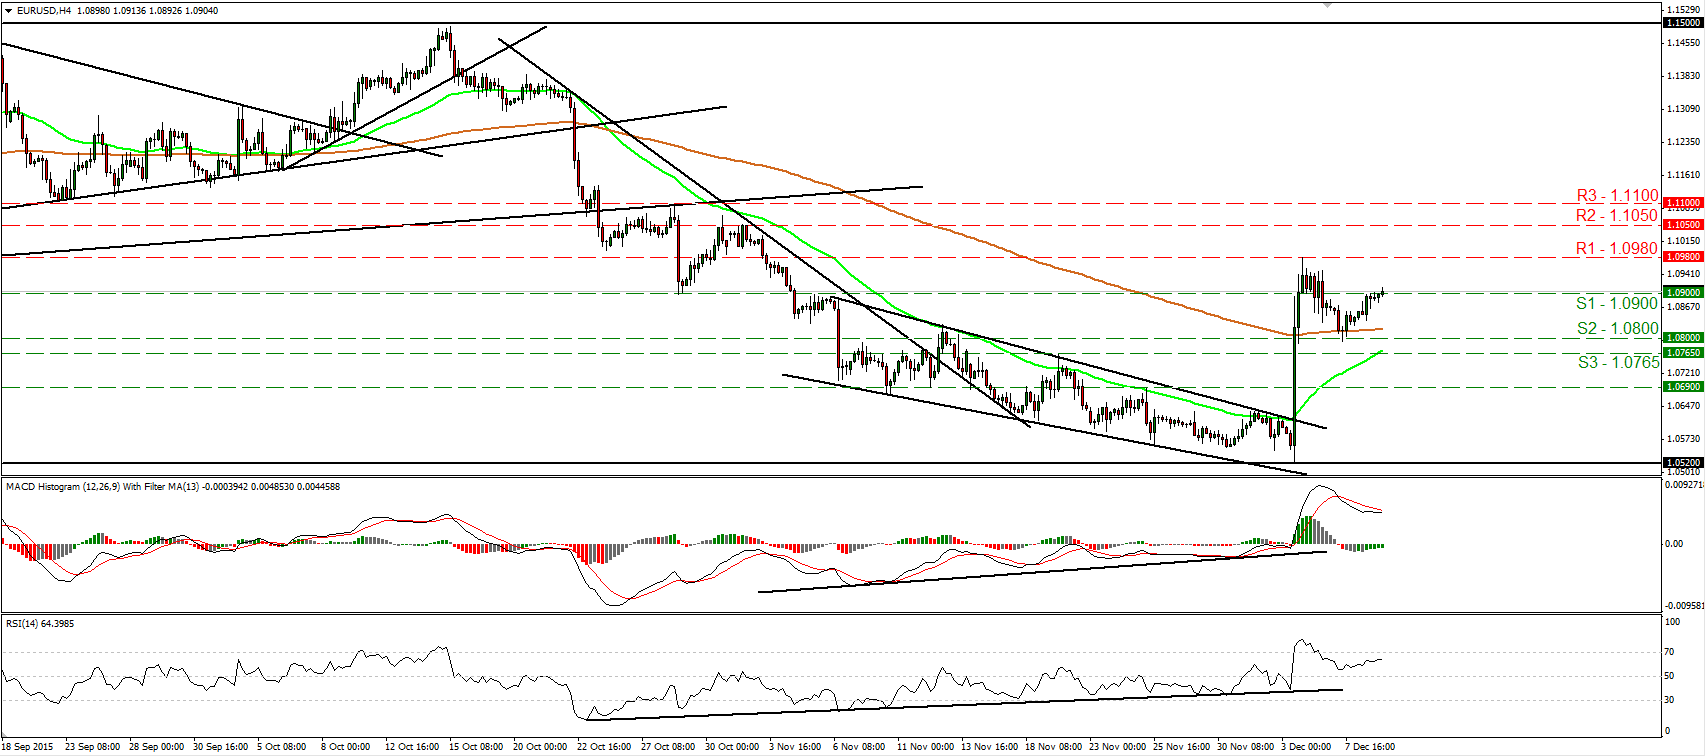
• EUR/USD traded higher on Tuesday and managed to break briefly above the resistance (now turned into support) line of 1.0900 (S1). The astonishing 500-pip rally last Thursday has turned the short-term picture positive in my view, while the rebound from near 1.0800 (S2) has confirmed a higher low on the 4-hour chart. As a result, I would expect the move above 1.0900 (S1) to set the stage for more bullish extensions towards the 1.0980 (R1) area, defined by Thursday’s peak. Shifting my attention to our short-term oscillators, I see that the RSI has turned up and is now headed again towards its 70 line, while the MACD, already positive, shows signs of bottoming. These indicators reveal upside momentum and corroborate my view for further advances. Switching to the daily chart, I see that the pair remains above the 1.0800 (S2) barrier, the lower bound of the range it had been trading from the last days of April until the 6th of November. As a result, although I believe the short-term picture has turned positive, I prefer to take a neutral stance as far as the overall outlook of EUR/USD is concerned.
• Support: 1.0900 (S1), 1.0800 (S2), 1.0765 (S3)
• Resistance: 1.0980 (R1), 1.1050 (R2), 1.1100 (R3)
GBP/USD trades lower but rebounds from 1.4955
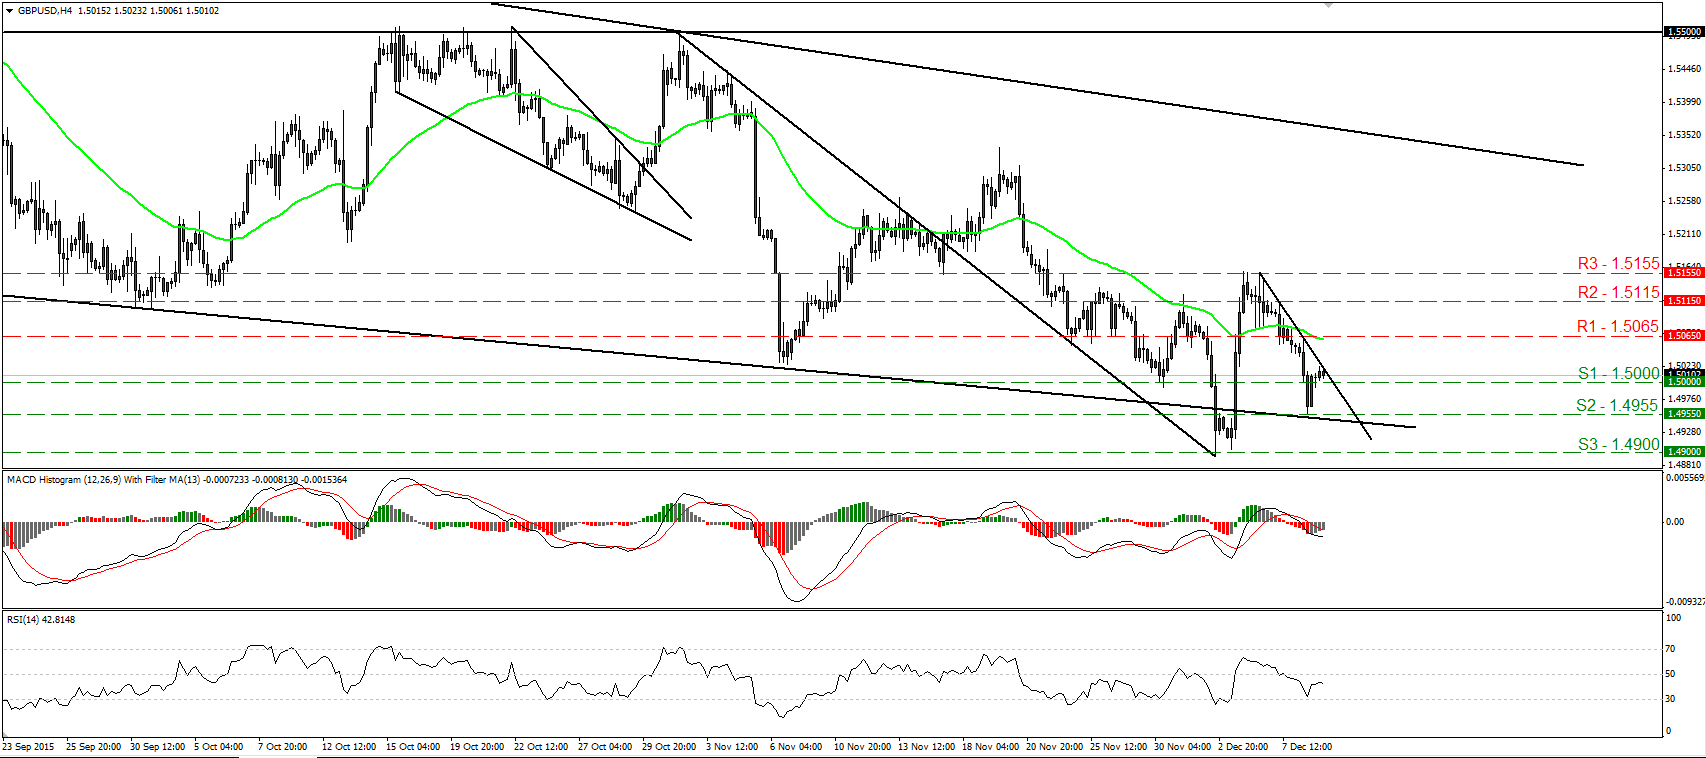
• GBP/USD traded lower yesterday, breaking below the 1.5000 (S1) psychological area. However, the rate found support at 1.4955 (S2) and then it rebounded back above the 1.5000 (S1) line. Given that the pair remains below the short-term downtrend line taken from the peak of the 4th of December, I would consider the intraday bias to stay somewhat bearish and I would expect another move below 1.5000 (S1) to target again the 1.4955 (S2) line. However, if we take a look at our oscillators, we see that the RSI rebounded from near its 30 line, while the MACD shows signs of bottoming slightly below its zero line. These signs leave the door open for the rebound to continue above the aforementioned trend line, perhaps for a test at the 1.5065 (R1) resistance hurdle. On the daily chart, the price structure remains lower peaks and lower troughs. What is more, the rate is trading below the 80-day exponential moving average, which it has turned down. Therefore, I still consider the longer-term trend to be negative and I would treat the recent recovery or any extensions of it as a corrective phase of that medium-term down path.
• Support: 1.5000 (S1), 1.4955 (S2), 1.4900 (S3)
• Resistance: 1.5065 (R1), 1.5115 (R2), 1.5155 (R3)
NZD/USD looks to be headed towards 0.6600
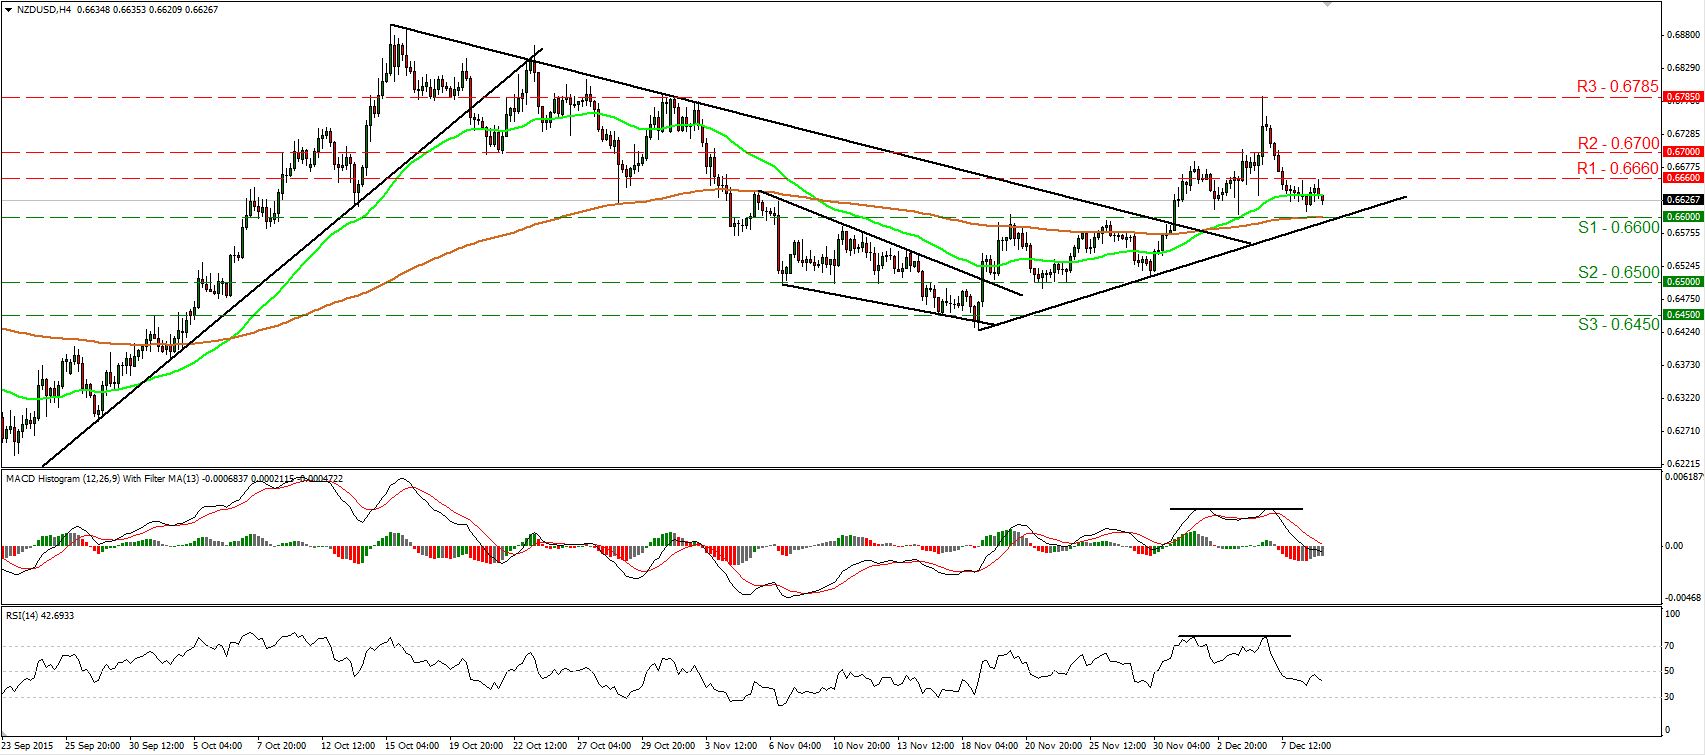
• NZD/USD slid on Tuesday and today during the early European morning, it looks to be headed towards the crossroad between the 0.6600 (S1) obstacle and the uptrend line taken from the low of the 18th of November. In my opinion, a clear break below the 0.6600 (S1) barrier would confirm the negative divergence between our oscillators and the price action, and is likely to turn the short-term outlook negative. Something like that could pull the trigger for larger bearish extensions, perhaps towards the psychological hurdle of 0.6500 (S2). Our momentum studies detect downside speed and support the case. The RSI hit resistance slightly below its 50 line and turned down, while the MACD, already below its trigger line, has turned negative. As for the broader trend, the decline started on the 15th of October makes me believe that the 23rd of September – 15th of October advance was just a corrective phase of the prevailing long-term downtrend. However, taking into account the recovery started on the 18th of November, I would keep a “wait and see” stance as far as the overall outlook is concerned.
• Support: 0.6600 (S1), 0.6500 (S2), 0.6450 (S3)
• Resistance: 0.6660 (R1), 0.6700 (R2), 0.6785 (R3)
Gold tests 1078
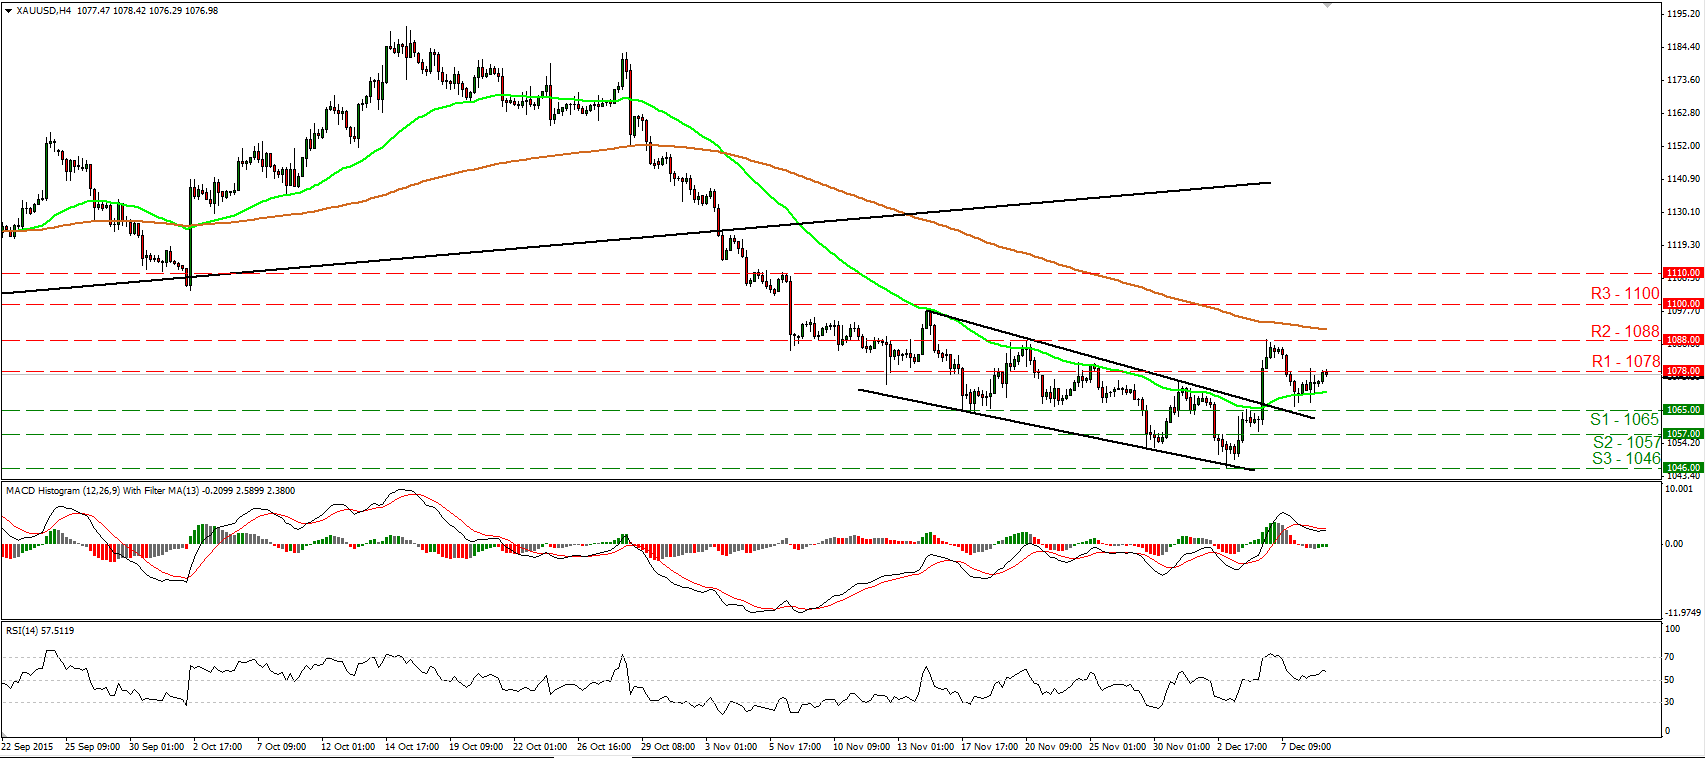
• Gold traded higher yesterday, but the advance was stopped by the 1078 (R1) level. Given that the precious metal printed a higher low fractionally above the 1065 (S1) line and the downtrend line taken from the peak of the 16th of November, I would consider the short-term outlook to be cautiously positive for now. A break above 1078 (R1) is likely to extend the positive wave and perhaps aim for another test at 1088 (R2), marked by the peak of the 4th of December. Our short-term oscillators support somewhat the notion. The RSI moved higher after it hit support at its 50 line, while the MACD shows signs of bottoming within its positive territory. On the daily chart, I see that the plunge below the upside support line taken from the low of the 20th of July has shifted the medium-term outlook to the downside. As a result, I believe that the metal is poised to continue its down road in the foreseeable future and I would treat the short-term recovery or any extensions of it as a corrective phase for now.
• Support: 1065 (S1), 1057 (S2), 1046 (S3)
• Resistance: 1078 (R1), 1088 (R2), 1100 (R3)
WTI hits 36.65 and rebounds
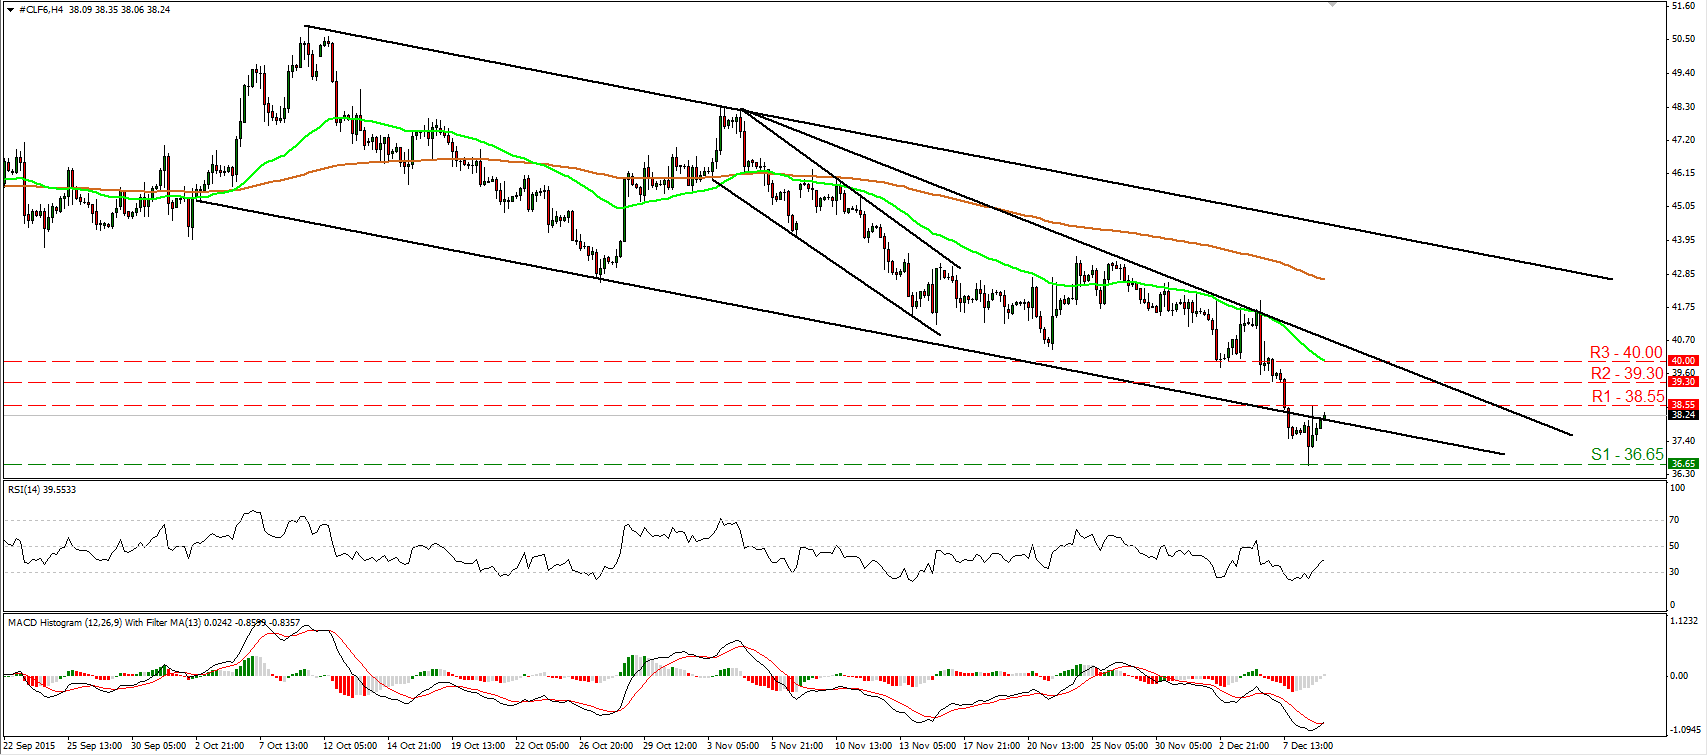
• WTI continued its tumble yesterday, but hit support at 36.65 (S1) and then it rebounded. The short-term trend remains negative in my view, but given yesterday’s rebound and taking a look at our short-term oscillators, I would expect the rebound to continue for a while. The RSI edged higher after it exited its below-30 zone, while the MACD has bottomed and crossed above its trigger line. A break above 38.55 (R1) is likely to confirm further rebound and could initially target the next resistance at 39.30 (R2). On the daily chart, WTI has been printing lower peaks and lower troughs within a downside channel since the 9th of October. Therefore, I would consider the medium-term outlook to be negative as well. I would treat any future near-term advances as a corrective phase for now.
• Support: 36.65 (S1), 36.00 (S2), 35.00 (S3)
• Resistance: 38.55 (R1), 39.30 (R2), 40.00 (R3)


