At last, crude oil moved a bit higher, so you might be asking yourself if the trend has reversed or is this just a pause before the moves continue.
In short, we think the latter is much closer to the truth.
The fact remains that in a global and hyperconnected economy like today, no market can sustain complete independence of the rest of the world. Crude oil, as the most versatile marketplace commodity, is not excluded from that reality.
Namely, the two markets that the black gold often looks up to the most are stocks and currencies. In today’s analysis, we’ll focus on the latter.
The black gold upswing has been relatively modest, and parallels with a similar pause in the USD Index. To validate this, let’s take a look at the following charts for more details.

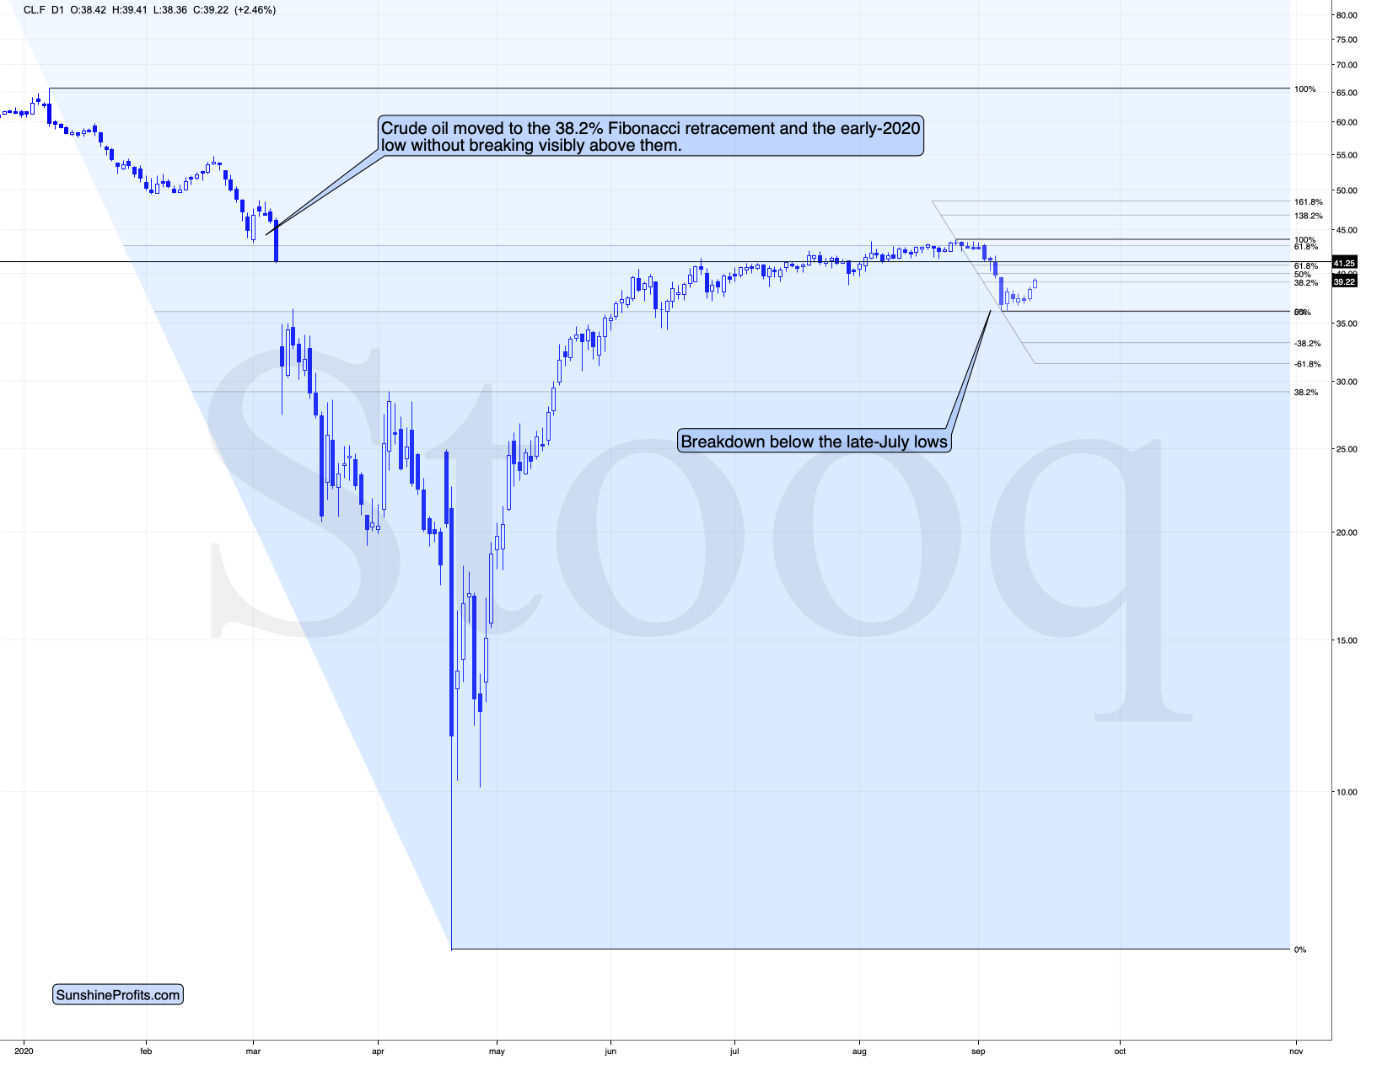
Crude oil has barely corrected the 38.2% of the most recent decline, which already includes today’s pre-market move higher. However, this is quite far from a game-changer move.
In reality, this move higher resembles the brief early-March pop-up higher that preceded one of the sharpest declines that we saw over the past decades. The preceding decline's size was broadly similar as well, which only adds to the likelihood of this rally becoming a slide.
And what about the USD Index? Well, in recent times, the USDX and crude oil moved in the opposite directions.

In particular, this month’s decline in crude oil corresponded to USD’s rally.
Therefore, if the USD Index is resting, an eventual pause in oil wouldn’t be surprising as well.
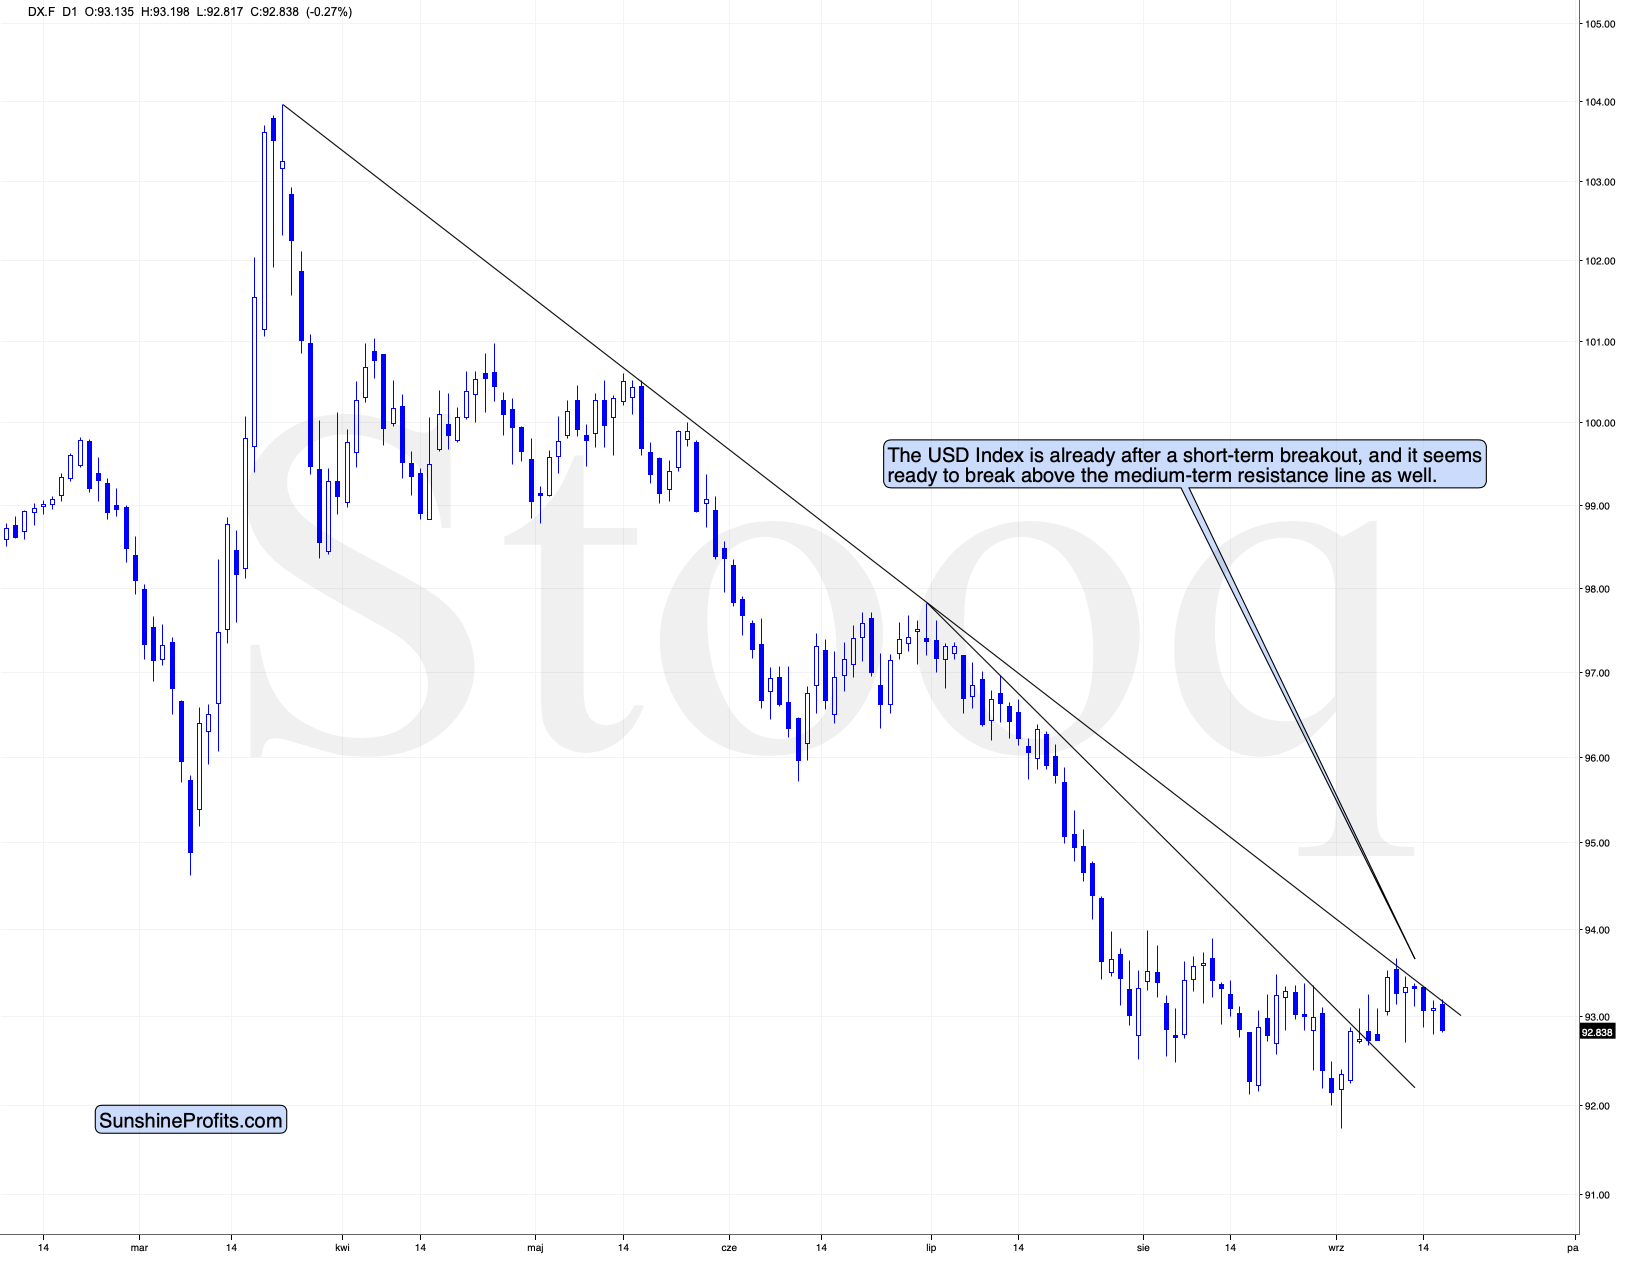
As a matter of fact, that’s precisely what the USD Index has been doing for the last several days. It’s been moving lower, at approximately the same pace as the declining medium-term resistance line is descending.
In other words, once the USDX finally does rally – even just a tiny bit – it’s likely to break above this important resistance and, thus, rally much higher. After all, that’s what tends to happen after significant breakouts.
Would this indeed represent a major breakout? Of course. This line already stopped the USD rally in early July, so it was verified as something that should be considered. The fact that the USDX was unable to rally above it earlier this month is yet more proof.
So, the big question is: How does the above translate into crude oil action? Well, it indicates that the decline is likely to resume quickly, and that the profits of our short positions will grow further.
Let’s not forget that the aforementioned happened right after crude oil failed to rally above the 61.8% Fibonacci retracement and the early-2020 lows. The strong resistance stayed on – despite the positive influence that the general stock market should have had on black gold. This means that the current move lower does indeed “have legs.” It’s not just a brief breather.
