There are many ways to skin a cat, that is for sure. Majority of the time, this blog focuses on contrarian opportunities. Some trade setups are more catered towards investors with a view of putting down long term bets, while other setups are more catered towards traders with short to medium term time horizons. Either way, the analysis of these opportunities is done with a view to try and achieve a strong trade return where probabilities might be skewed towards a contrarian approach, as this is where strong gains might occur.
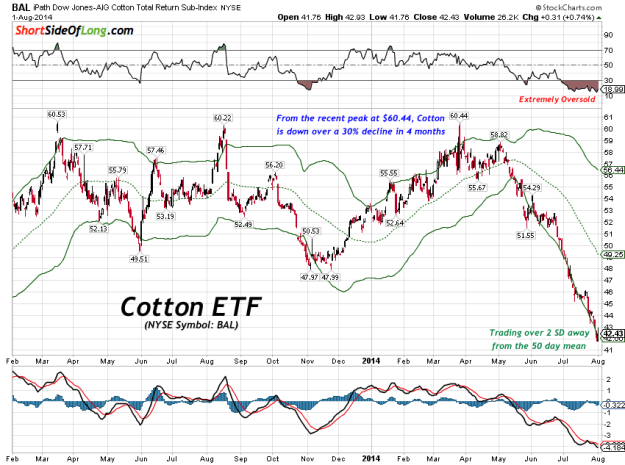
Chart 1: Cotton has become extremely oversold after a 3 month crash!
Source: Stock Charts (edited by Short Side of Long)
Agriculture has been under intense selling pressure since May of this year. We have covered grain commodities a few times over the last several weeks, as we patiently wait for liquidation to end (we sure are coming close). Some of the soft commodities, such as Cotton, are now also joining grains in a basket which I would like to call “totally slaughtered and left for dead”.
Chart 1 seen above, shows us that Cotton prices have literarily gone straight down for the last three months. Various technical indicators are now so oversold towards extremes, that current condition can be classified as once in a decade type of an event. Furthermore, reader should also understand that Cotton is now down 12 out of the last 13 weeks, which is also a very rare streak of losses.
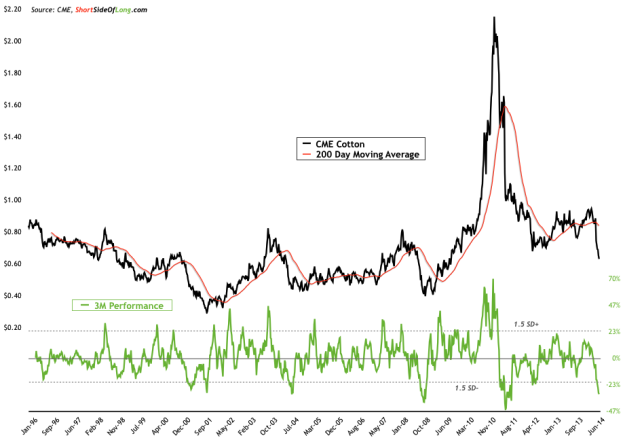
Chart 2: Prices are down 2 SDs away from normal quarterly performance
Cotton ETF (iPath DJ-UBS Cotton TR Sub-Index (NYSE:BAL)) is down 30% over the last 4 months, while Cotton spot prices are experiencing a two standard deviation downside event over a 3 month rolling performance. As we should be able to observe in Chart 2, the current price crash did not occur after a strong run up unlike in 2003, 2008 and especially in 2011. Therefore, the current oversold condition definitely stands out as more unique then a previous few.
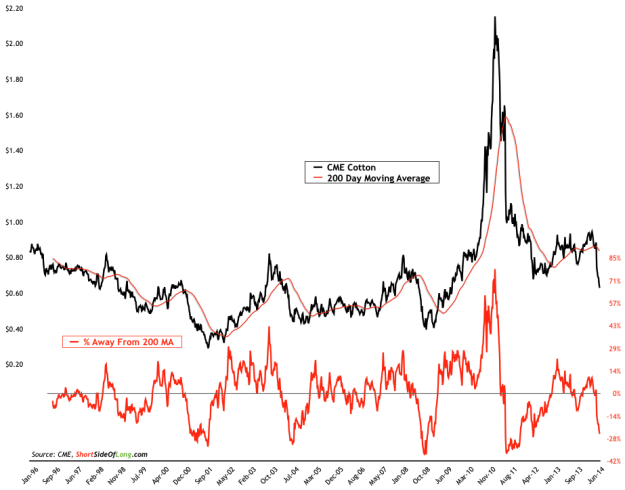
Chart 3: Technically, the price is moving very far away from its mean…
Obviously, not all indicators that measure how oversold Cotton is point to an immediate bottom (however this is still quite possible). In Chart 3, we should also be able to notice that while the price is now very far away from its 200 day moving average on the downside, historically a bottom tends to be found as the rubber band stretched even more. Therefore, there is always a possibility for the crash to continue for awhile longer. However, bear in mind that history doesn’t necessary have to repeat, but it does rhyme and we seem to be approaching an inflection point.
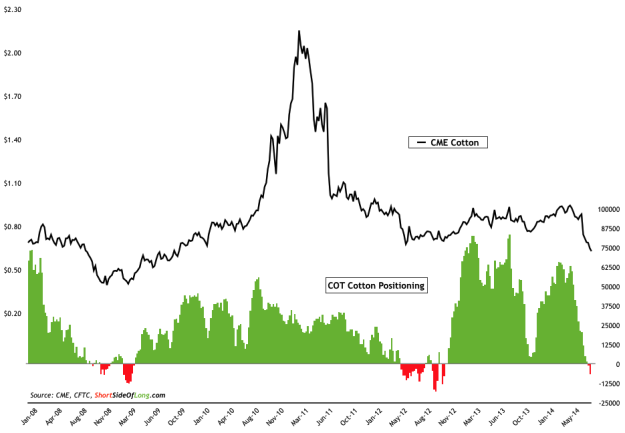
Chart 4: Hedge funds and other speculators are now net short Cotton!
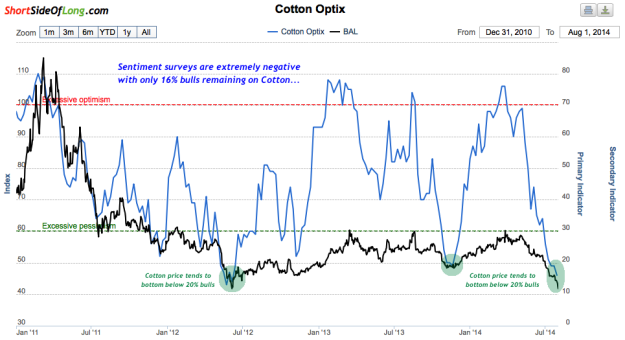
Speaking of inflection points, sentiment indicators definitely agree. Both Chart 4 & Chart 5 show us that there are basically no bulls left on this soft commodity. The chart above shows that hedge funds and other speculators have now turned net short on Cotton. Previous two occurrences in late 2008 and middle of 2012 led to immediate bottoming process and proved to be a great contrarian buy signals. This is also confirmed by Chart 5 below, where we can see various sentiment surveys signalling rock bottom negative sentiment.
I would like to make two further observations with SentimenTrader data available to me. Firstly, keep in mind that last few instances where sentiment dropped below 20%, Cotton bottomed out almost immediately just like with COT indicator in Chart 4. Secondly, throughout history of the survey, sentiment readings have rarely been at or below 20% for a whole month. Over the last decade we have seen such conditions in July 2004, October 2008, May 2012 and November 2013. The month of July 2014 marks the fifth time!
Chart 5: According to sentiment surveys, there are barely any bulls left
Source: SentimenTrader (edited by Short Side of Long)
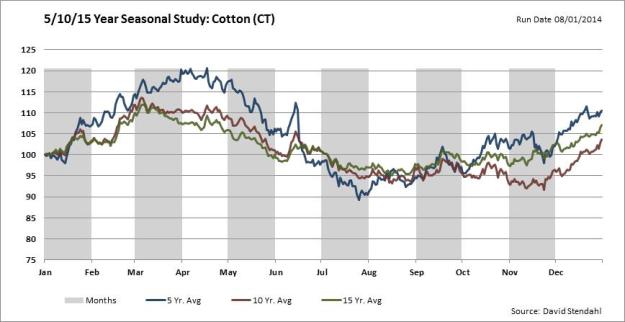
Finally, seasonal traders will agree that Cotton has been behaving just as expected this year (as it did last few years too). We saw a price peak into March as the planting usually starts in the Northern Hemisphere. By June, it became obvious that investors levels were going to grow higher for a fifth consecutive year, resulting in a dramatic pressure on the price. However, sentiment indicators above now warn us that selling is probably way overdone.
So are we approaching a seasonal bottom? Well, majority of the time, Cotton tends to bottom just prior to Autumn, as harvesting is about to start. Therefore, seasonal traders should be looking for a reversal very soon, with the probability of that increasing due to extremely oversold indicators and sentiment. Personally, I will be looking to purchase some Cotton positions for a trade, at appropriate time in coming days or weeks.
Chart 6: Cotton tends to peak around March and bottom into mid year!
