- Apple (AAPL) has become the world's largest company by market capitalisation... ever. It has now eclipsed Microsoft's market cap peak in late December 1999 during the technology bubble in nominal terms (not inflation adjusted terms). Amazingly, the parabolic run has created gains of 81 times over the last 10 years. Disclosure: I have started shorting Apple with OTM 2014 Puts.
- The Nasdaq Composite approached March highs on the back of some of the weakest and narrowest breadth I have ever seen. When we look at the number of tech stocks making 52 Week New Highs and smooth it out over an one month time frame, the results are flashing warning signals as majority of the tech companies are failing to confirm the rally.
- A few weeks ago I wrote about how the British Pound was a good short. I still believe this to be the case, as I think the pound's major consolidation pattern will resolve to the downside. I believe that the UK is going to enter a more serious slowdown but I seem to be in the minority, as many traders turn very optimistic towards future prospects of the British pound.
- Precious metals are breaking out from their technical pressure points. We saw platinum start the move, followed by silver and finally gold has now joined the party too. While gold bugs are celebrating, I think the real test is ahead of us. PMs need to prove that they can rally even if volatility rises, risk assets including stocks sell-off and the US dollar starts to rally again.
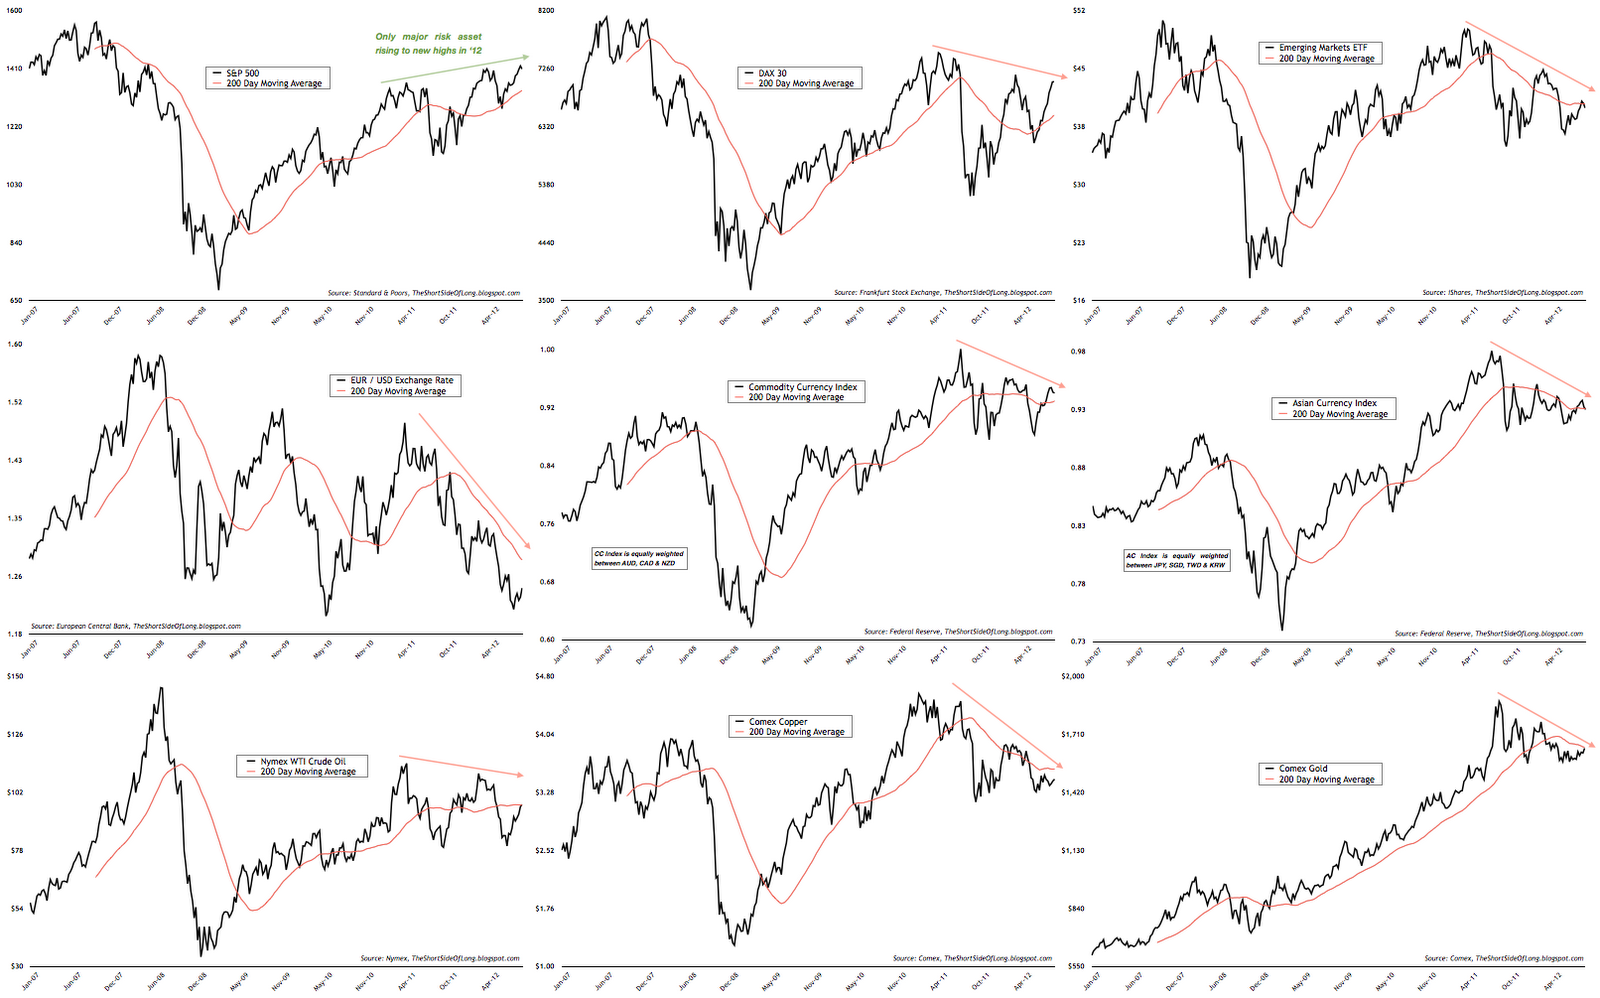
We continue to see that industrial economic barometers like copper and crude oil are failing to rise above the 200-day MA and confirm the S&P 500's new highs in 2013. The Emerging Markets, saviour of global growth in the post Lehman recovery, also continue to lag other equity indices indicating that not all is well with the BRICs. Furthermore, the short term rise in the DAX 30, Commodity Currencies and Brent crude (not shown here) has been almost vertical and caution is advised. Finally, gold seems to be attempting a technical upside breakout, but the real test will be coming as global risk asset's volatility rises and the US dollar starts to rally again.
Leading Indicators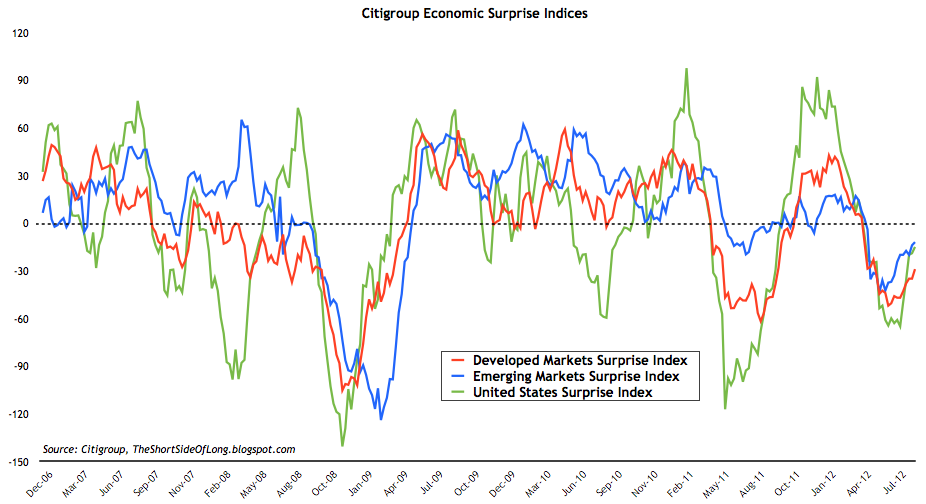
Global economic data continues to beat economist's expectations. Like previously stated, this is a positive for the time being and it has been helping global stocks and other risk assets move higher in the last couple of weeks. However, keep in mind that this indicator does not actually state weather or not global economy is improving, but just weather the data is coming in below or above economists expectations. During the middle of 2008, US economic data improved relative to economists expectations, and yet the recession just intensified and markets crashed afterwards.
Bulls from CNBC to Bloomberg are trying to convince bearish investors that the US economy is improving. Even some of the more respected investors are falling into the bullish trap as well. Some of them are even celebrating the fact that the ECRI Growth Index has risen from -3.5% to -0.6% (chart below) over recent weeks. Can I just ask, since when did a negative leading economic number deserve so much celebration and bullish speculation? 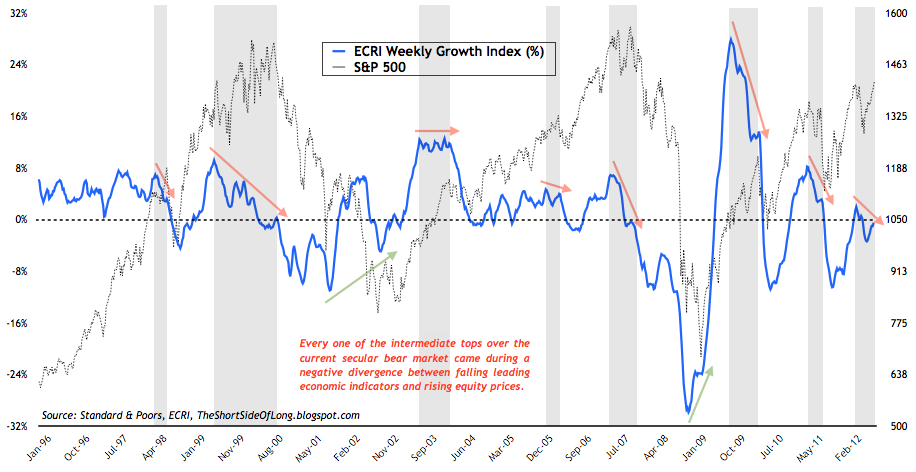
Do not believe the hype, as there is no strong evidence to support economic improvements. Money printing is having less and less of an effect on the economy. The chart above shows that every one of the intermediate tops over the current secular bear market came during a negative divergence between falling leading economic indicators and rising equity prices. We currently have higher rising prices during falling leading economic activity (another bearish non-confirmation), so will this time be different?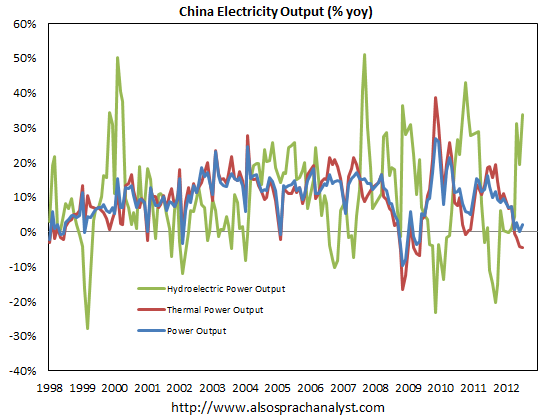
The chart above, thanks to alsosprachanalyst.com, shows that Chinese electricity output remains flat at best. Chinese National Bureau of Statistics showed that hydroelectric power was the recent overall output growth remained above 0%. More importantly, thermal power output growth keeps sliding in July towards -4.5%. Why is this important, you ask? Because electricity production has high correlation with Chinese GDP (which cannot be completely trusted) and global mining sector performance. All in all, Chinese leading data continues to slow. China holds the key to future prospects of copper prices, and the feature article below explains why.
Featured Article
I have been reading a variety of investment bank newsletters in my inbox over the last few days. The ones I always look forward to reading are commodity related newsletters because it is my opinion that commodities are still in a secular bull market, which started in 1999. The comment that stood out for me was by UBS Commodity Connections Q3 2012 newsletter, which stated that:
"China, the primary fundamental driver of the global copper price, has reported record-high semi-manufactured production rates, and a corresponding large drawdown in inventories. Now short copper, China’s likely to buy throughout H2, supporting the metal’s price."
So UBS is bullish on copper, one of the main barometers of global growth. I am in no position to argue for or against USB, as they have large team studying ground conditions regarding various copper fundamentals, as well as in-house export technical analysts. Nevertheless, I thought I would investigate matters further, but before we begin, it is important to understand that even though we are in a secular commodity bull market, there are periods when bears take over cyclical fundamental forces against the overall bullish price trend. One could say that we have been in a cyclical bear market for commodities for about a year now (chart below). 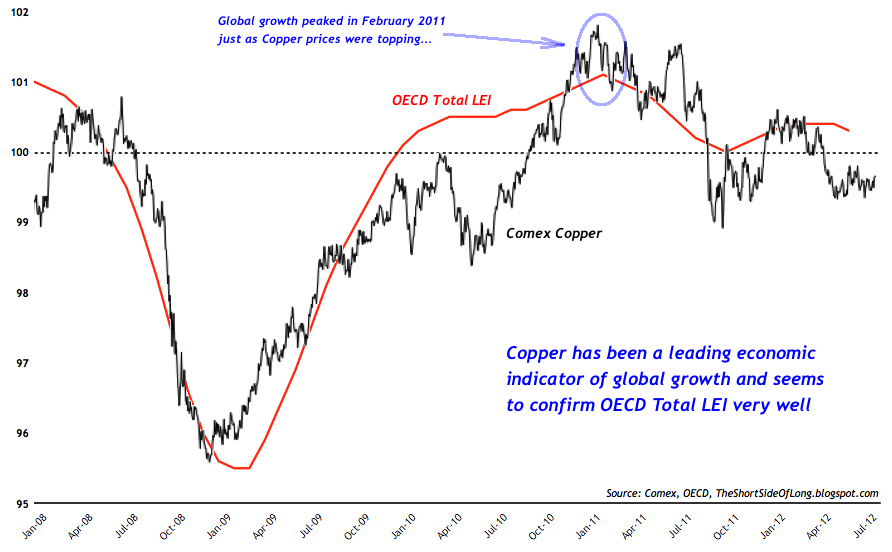
Personally, I follow copper prices very closely and the reasoning is mainly towards its ability to predict global economic activity. I do not own any copper, nor do I own any copper mining companies. As we can see in the chart above, copper prices have a close relationship with OECD Global Leading Economic Indicators. Therefore, one could easily understand that the peak in copper prices, which occurred in February 2011, corresponded with the peak in global economic growth. The global economy has been slowing since than, just as copper prices have been in a downtrend (bear market).
Now, am I sure all the investors want to know if the bear market is over?
Well to answer that question, one has to start paying closer attention to economic activity in Asia. This is most important for US-centric investors, who tend to hold a narrow minded vision towards the US and Europe (old world economy). You see, while the majority of investors are constantly focused on Europe and discussing Greece or Spain, it is China together with the rest of Asia that holds major upside as well as major downside risks to both the price of copper and therefore the overall global economic activity. 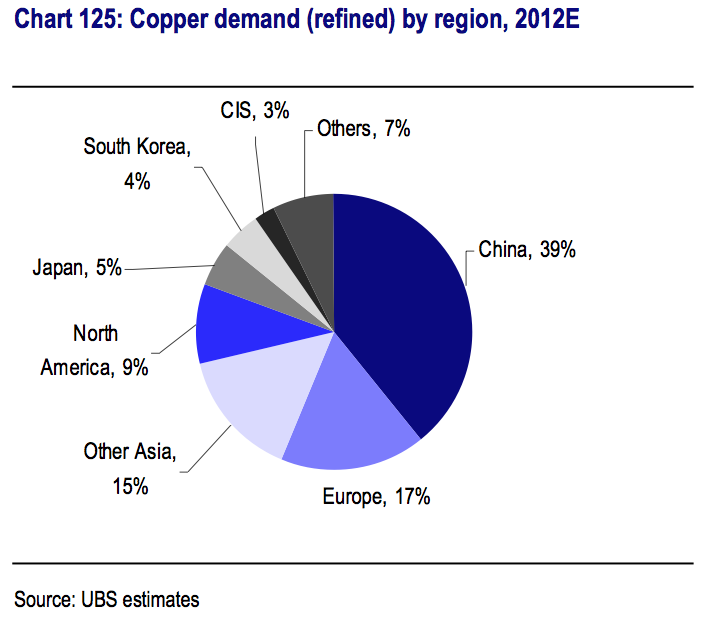
The overall region consumes almost 60% of the global copper supply (including Japan), as we can see from the chart above thanks to UBS. It becomes plainly obvious that inter-linked growth spreads even further towards many commodity exporting countries like Brazil, Australia, Canada, Indonesia, South Africa, New Zealand, Argentina, Mongolia among many others. In other words if China, as well as overall Asia slow down, world growth will be heavily affected.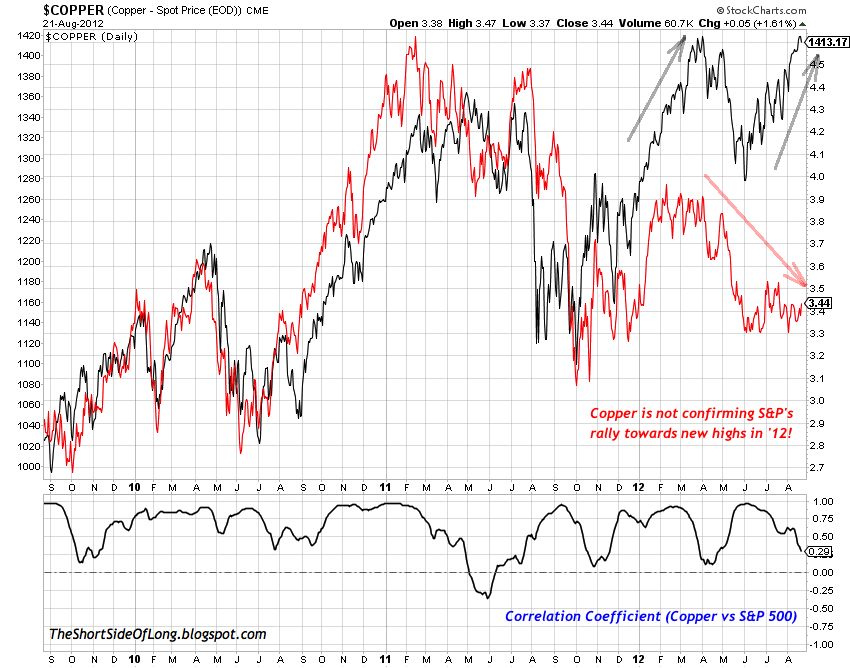
One region that is not affected yet is the United States. One important observation to make is that while Copper has been weakening since February 2011, which most likely tells us that Asia is slowing down meaningfully, the S&P 500 has continued to flirt with new highs in 2012. Therefore, bulls have started using the de-coupling phrase for the first time since late 2007. The UBS team of researchers also does not see any major problems ahead:
- "We forecast global copper demand growth of 3.2% to 20.6mt in 2012, driven by +6% in China (8.1mt), with only +0.4% in the G7 (5.3mt).
- China’s record-high semis production rate has resulted in a sharp drawdown in metal. As such, we should expect some price-supporting buying in H2.
- Policy easing in China, aimed at promoting economic activity, would also be price supportive events for the credit-driven trade of copper.
- UBS forecasts a deficit of 167kt in 2012 and market should then return to equilibrium in 2013E.
- Note: A genuine supply response to the prolonged strength in the copper price is underway, mainly out of South America."
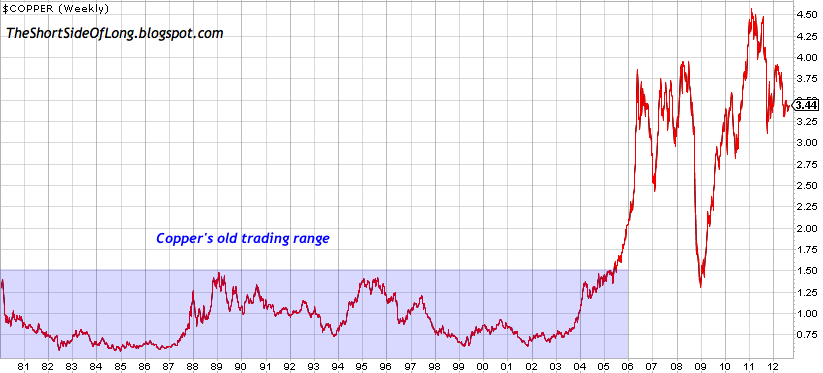
From the supply side perspective, I tend to agree with UBS that "a genuine supply response" is underway due to "prolonged strength in the copper price," as we can see with the chart above. Copper prices have been trading in a whole new range averaging about $4.00 per pound on the upside and $2.50 per pound on the downside. Having said that, I am much more concerned about the demand side, as I do not believe all is well with the Chinese economy. It is difficult to judge the current true growth in the Chinese economy with official data saying 7.6%, while some well respected analysts say it is closer to 4%.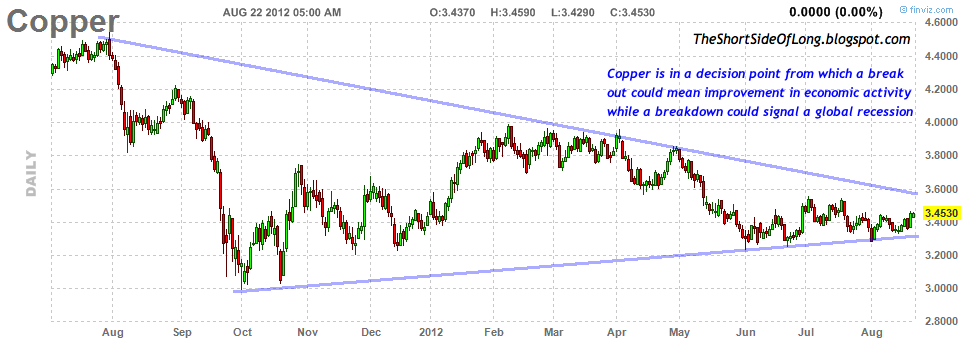
With that in mind, I rather give the market a chance to tell me what is happening, while I sit back watch and listen. The chart above explains perfectly what I mean. We can see that the price of copper has essentially gone nowhere over the last year or so, and we have now triangulated into the climax of a decision point.
A proper break out (no reversals) would establish a bullish foundation in a sign that the Chinese economy, together with rest of Asia, is not crashing with demand remaining strong. Global economic activity would therefore pick up across the globe and copper prices would rise into new highs. This would stimulate the global mining sector, which is currently experiencing a severe downturn.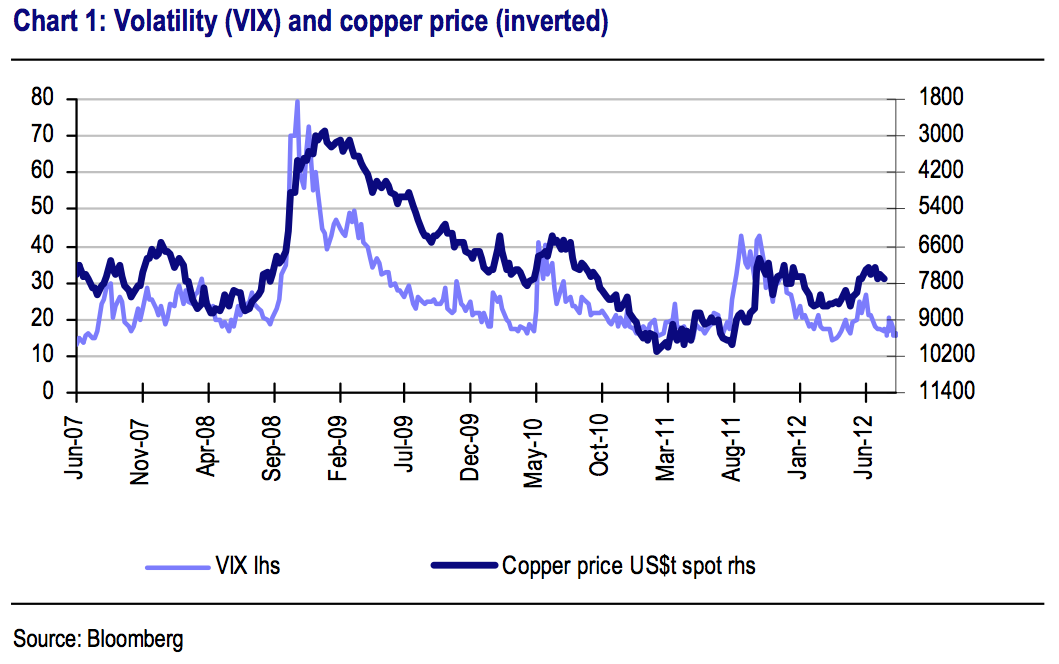
On the other hand, a break down would most likely signal that Asia as well as China is in trouble, and that the Chinese property sector is entering a hard landing scenario. Demand would be overwhelmed by supply, which is still coming onboard and prices could fall hard in a continuation of a cyclical downturn. The chart above shows that inverse price of copper correlates very well with the VIX, which currently finds itself at very complacent levels, which in my opinion is a major warning signal.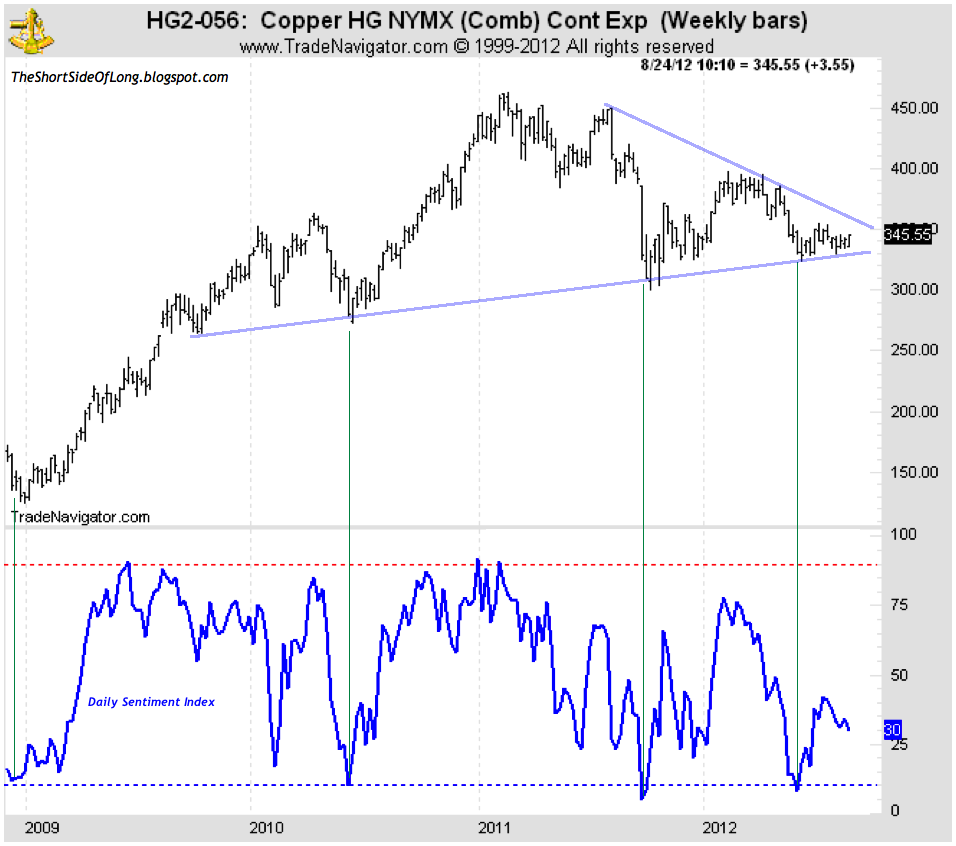
Sentiment on copper is slightly negative, but not extremely depressed. The Daily Sentiment Index shows 30% bulls as of yesterday. Do keep in mind that bulls dropped below 10% during September of 2008, only to see copper prices continue to crash in late 2008. Those who jumped in as brave contrarians, dismissing selling pressure during the awful fundamental backdrop, lost their shirt and their socks. Therefore, one needs to understand that demand and supply fundamentals can overwhelm the technical picture at times. One also needs to understand that further price disappointments do occur from negative sentiment levels, especially when there is failure to recover on the back of "stimulus rumours."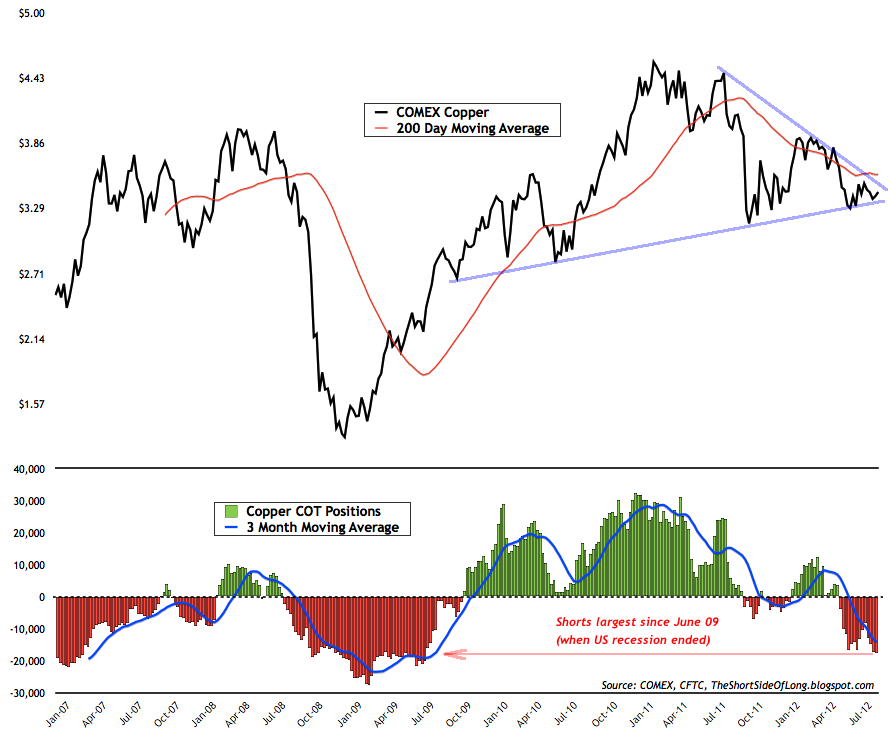
For example, in the chart above we can see that hedge funds have been shorting copper for weeks, which tends to be a contrarian buy signal and yet copper prices have failed to stage a proper recovery from June lows. Compare that to the likes of US or German equities (Nasdaq or DAX) which seem to be rising vertically, and you can safely assume not all is well within the copper market.
In summary, one can conclude that copper is now at decision point and its technical break in either direction could tell us more about the future direction of the global economic activity than any analyst on CNBC or Bloomberg. Therefore, make sure you keep your eyes on the price of copper over the coming weeks and months. As for my own view - I'm bearish and expect copper to eventually break down before we bottom.
Trading Diary (Last update 22nd of August 12)
- Outlook: I am of the opinion that the risk asset bear market is upon us and that the global economy continues to slow rapidly into a recession. United States GDP has grown 5 out of the last 6 quarters below 2%, which tends to be stall speed. German GDP is also at stall speed, similar to 2008. China and India are slowing meaningfully and could experience a serious hard landing. At the same time US corporate earnings and gross profit margins are at record highs, so I expect a mean reversion unlike so many stock analysts. Cash levels with mutual funds, retail investors and money market funds are at extreme lows, financial stress is starting to rise, volatility is at very complacent levels and credit spreads are very narrow relative to fundamentals, so I expect a risk off scenario in due time.
- Long Positioning: Long focus is towards secular commodity bull market, with precious metals and agriculture offering the best value. Largest commodity position is held in silver, as central banks will eventually print money as the global economic activity deteriorates. Since silver has broken out recently, hedges have been removed and a small purchase was made. Any negative reversal, as global risk asset volatility rises, will call for hedging again. NAV long exposure is about 100%.
- Short Positioning: Short focus is towards secular equity bear market, with cyclical sectors and credit offering best selling opportunities due to deteriorating global growth. Mild to modest exposure is held short in the Junk Bond market, as well as various economically sensitive cyclical sectors like Technology, Discretionary and Dow Transportation. Recently, the Apple parabolic has been shorted with long dated 2014 OTM puts. NAV short exposure is about 60%.
- Watch-list: Commodity currencies like aussie, kiwi and loonie are also on my watch list of potential shorts right now, as negative surprises await with China slowing dangerously. With the euro being the most hated currency, a better risk off trade could be selling the British pound. A major short in due time will be US Treasury long bonds, as they are extremely overbought and in a mist of a huge bubble mania, but first we have to wait for the eurozone dust to settle. Finally, while grains have exploded up, softs still present amazing value for long term investors, with sugar being my second favourite commodity (after Silver).
