Putting aside the fact the copper should probably be leading the risk rally train, it seems worth noting that this economic bellwether has failed to reverse the downtrend created out of last summer’s correction as is the case of the basic materials sector ETF comprised of many of the US economy’s core companies.
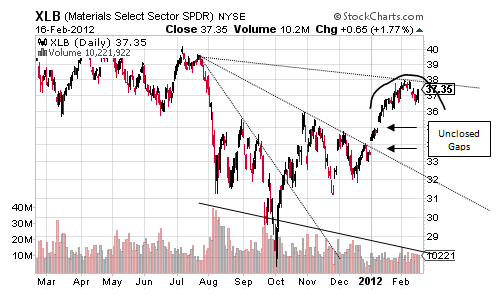
Starting out with the Materials SPDR XLB, it needs to trade above its third Bull Fan Line to reverse its intermediate-term downtrend, but what makes the XLB’s failure to trade above its third Bull Fan Line yet is the fact that it is the only S&P sector ETF to be in that possibly awkward position while the equity indices made that cross weeks ago as well. 
Put otherwise, basic materials appears to be the only S&P sector to have not recovered from last year’s correction yet even as the S&P has reversed its own intermediate-term downtrend to an intermediate-term sideways trend.
That being said, the XLB is not far from proving such a reversal to a sideways trend from a downtrend and this will happen pretty safely if the XLB closes above $38. It may struggle to do so, though, considering that its near-term uptrend recently turned near-term mixed on a Rounding Top that may try to close at least the higher of those unclosed gaps at $35 with the lower one near $33.50.
In turn, the XLB seems worth watching as a possible reason to believe that this year’s rally may lose a little steam in the coming weeks and something that seems consistent with the VIX setting up a potential near-term spike toward 30.00.
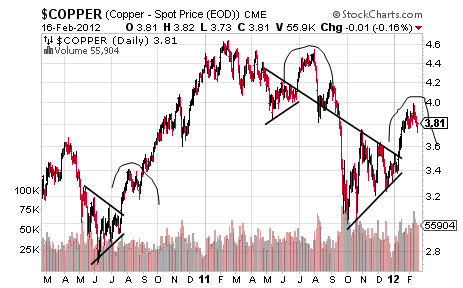
Equally worth watching is copper considering that it has failed to rise above its third Bull Fan Line as well but perhaps more interesting is the fact that copper is trading in a Rounding Top to follow a Symmetrical Triangle and the precise pattern combination that led to two very different risk asset market environments – the QE2 rally and the correction last August.
What makes the current Symmetrical Triangle leading into a Rounding Top pattern quite interesting is the fact that the top trendline of the Symmetrical is the very same top trendline of last summer’s Symmetrical Triangle and this may suggest that both Rounding Tops were odd little kickback rallies with the one leading to a decent decline with it remaining to be seen what the current Rounding Top leads to in the weeks ahead.
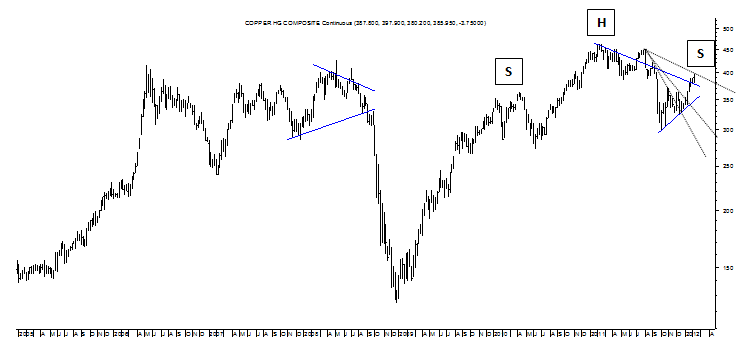
Should copper’s current Rounding Top confirm by copper dropping below $3.63/lb, copper’s current pattern combo will probably lead to an initial decline of about $3.35/lb and a level that would set up copper for a much bigger decline on the potential Head and Shoulders pattern showing in the weekly chart below.
This extreme Head and Shoulders pattern in copper confirms around $3.00/lb for a target of about $1.50/lb while it is also interesting to see the continuity of copper’s intermediate-term downtrend as shown by the larger Symmetrical Triangle along with copper’s current positioning below its third Bull Fan Line.
Just like the basic materials sector, though, this chart can be watched by the levels and levels that should be respected as a pretty strong sign of what’s ahead for copper and probably the longevity of the current risk rally too and those levels are $3.63/lb and $3.73/lb on the downside and $3.97/lb and $4.06/lb on the upside. Above the latter levels and copper will probably trade toward $4.30/lb at a minimum while a decline below the former levels will take copper toward the aforementioned $3.35/lb at a minimum.
Bigger picture, should copper rise above those higher levels, it will show that copper has reversed its intermediate-term downtrend to hop on the risk rally train for what might turn out to be quite a nice ride, but below the lower levels and it will show there was a reason that copper and materials never got fully on board.
Sam’s Stash, Gold and the S&P
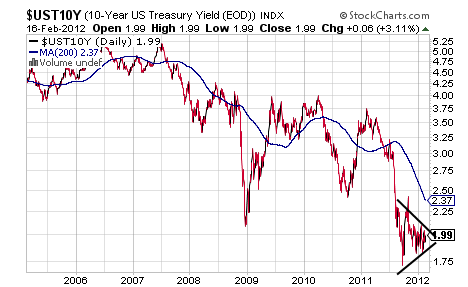
Interestingly, the 10-year Treasury yield looks very little the way it looked at the start of the QE2 rally or at the start of last year’s correction in risk nor does it look very much as it did at the very start of the asset inflation train’s trek up back in March 2009. 
That being said, its current Symmetrical Triangle may serve as a bottoming pattern that confirms at 2.38% for a target of about 3.00%, but the downward trajectory of its 200 DMA may provide some support for thinking seriously about this pattern’s downside target of about 1.25%.
Irrespective of how this pattern does break, it is similar to the Rounding Top in copper in the fact that it appears ready to break soon as in within weeks, if not sooner, and this would seem to suggest that a good bit of uncertainty will be reentering the fundamental picture or that past uncertainties around Europe, global growth and the US economy will find clarification to the positive.
And perhaps it makes sense to hope for the latter but to be somewhat prepared for the former.
- English (UK)
- English (India)
- English (Canada)
- English (Australia)
- English (South Africa)
- English (Philippines)
- English (Nigeria)
- Deutsch
- Español (España)
- Español (México)
- Français
- Italiano
- Nederlands
- Português (Portugal)
- Polski
- Português (Brasil)
- Русский
- Türkçe
- العربية
- Ελληνικά
- Svenska
- Suomi
- עברית
- 日本語
- 한국어
- 简体中文
- 繁體中文
- Bahasa Indonesia
- Bahasa Melayu
- ไทย
- Tiếng Việt
- हिंदी
Copper and Materials Not on Board the Risk Rally Train
Published 02/22/2012, 05:22 AM
Updated 07/09/2023, 06:31 AM
Copper and Materials Not on Board the Risk Rally Train
3rd party Ad. Not an offer or recommendation by Investing.com. See disclosure here or
remove ads
.
Latest comments
Install Our App
Risk Disclosure: Trading in financial instruments and/or cryptocurrencies involves high risks including the risk of losing some, or all, of your investment amount, and may not be suitable for all investors. Prices of cryptocurrencies are extremely volatile and may be affected by external factors such as financial, regulatory or political events. Trading on margin increases the financial risks.
Before deciding to trade in financial instrument or cryptocurrencies you should be fully informed of the risks and costs associated with trading the financial markets, carefully consider your investment objectives, level of experience, and risk appetite, and seek professional advice where needed.
Fusion Media would like to remind you that the data contained in this website is not necessarily real-time nor accurate. The data and prices on the website are not necessarily provided by any market or exchange, but may be provided by market makers, and so prices may not be accurate and may differ from the actual price at any given market, meaning prices are indicative and not appropriate for trading purposes. Fusion Media and any provider of the data contained in this website will not accept liability for any loss or damage as a result of your trading, or your reliance on the information contained within this website.
It is prohibited to use, store, reproduce, display, modify, transmit or distribute the data contained in this website without the explicit prior written permission of Fusion Media and/or the data provider. All intellectual property rights are reserved by the providers and/or the exchange providing the data contained in this website.
Fusion Media may be compensated by the advertisers that appear on the website, based on your interaction with the advertisements or advertisers.
© 2007-2024 - Fusion Media Limited. All Rights Reserved.
