
Cooper-Standard Holdings Inc. (NYSE:CPS) reported adjusted earnings of $1.53 per share in fourth-quarter 2018, missing the Zacks Consensus Estimate of $1.99. Further, the bottom-line figure was lower than the year-ago quarter figure of $3.42 per share. Challenging market conditions in Asia and Europe, and increasing commodity costs impacted the company’s results.
Sales were $872 million, which missed the Zacks Consensus Estimate of $895 million. The year-ago figure was $938 million. The decline in sales was primarily due to unfavorable volume and mix, foreign exchange, and price adjustments, partly offset by positive impacts of acquisitions and divestitures.
During the reported quarter, adjusted net income was $27.5 million, down from the prior-year quarter figure of $63.6 million. Adjusted EBITDA declined to $76.4 million from $131.2 million recorded in the fourth quarter of 2017.
Cooper-Standard Holdings Inc. Price, Consensus and EPS Surprise
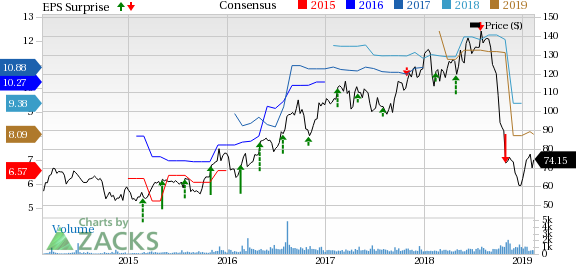
Cooper-Standard Holdings Inc. Price, Consensus and EPS Surprise | Cooper-Standard Holdings Inc. Quote
2018 Results
In 2018, the company’s adjusted net income was $160.7 million or $8.79 per share, a decline from $208 million or $11.08 per share.
The company’s sales were $3.63 billion in 2018 compared with $3.62 billion generated in the prior year.
Segmental Performance
Sales in the North America segment were $476.4 million, marking a decline from the year-ago quarter figure of $479.4 million. In fourth-quarter 2018, the segment’s profit was $51.3 million, marking a decline from $65.2 million recorded in the prior-year quarter.
Sales in the Europe segment were $230.2 million in the fourth quarter, down from $267.4 million in fourth-quarter 2017. The segment’s loss was $57.2 million against profit of $1.8 million in the prior-year quarter.
The Asia Pacific segment reported sales of $143.1 million in the reported quarter, down from $163.2 million in fourth-quarter 2017. The segment recorded loss of $68.6 million, down from loss of $1.1 million in fourth-quarter 2017.
The company’s South America segment reported sales of $22.3 million during the quarter under review, down from $27.9 million in fourth-quarter 2017. The segment’s loss was $3.7 million, down from the prior-year quarter’s loss of $2.6 million.
Financials
Cooper-Standard had $265 million of cash and cash equivalents as of Dec 31, 2018, compared with $516 million as of Dec 31, 2017. The company had long-term debt of $730 million as of Dec 31, 2018, compared with $723.3 million recorded as of Dec 31, 2017.
2019 Outlook
For 2019, the company anticipates sales of $3.4-$3.6 billion and adjusted EBITDA of $300-$340 million. Further, the company expects capital expenditure of $180-$190 million.
Zacks Rank & Other Key Picks
Cooper-Standard currently carries a Zacks Rank #2 (Buy). A few other top-ranked stocks in the broader auto sector are General Motors Company (NYSE:GM) , American Axle & Manufacturing Holdings, Inc. (NYSE:AXL) , and Oshkosh Corporation (NYSE:OSK) , each currently carrying a Zacks Rank #2. You can see the complete list of today’s Zacks #1 Rank (Strong Buy) stocks here.
General Motors has an expected long-term growth rate of 8.5%. Share price of the company has increased 8.7% in the past three months.
American Axle has an expected long-term growth rate of 8.1%. Over the past three months, shares of the company have gained 23.1%.
Oshkosh has an expected long-term growth rate of 11.3%. Shares of the company have gained 16.3% in the past three months.
Zacks' Top 10 Stocks for 2019
In addition to the stocks discussed above, wouldn't you like to know about our 10 finest buy-and-holds for the year?
From more than 4,000 companies covered by the Zacks Rank, these 10 were picked by a process that consistently beats the market. Even during 2018 while the market dropped -5.2%, our Top 10s were up well into double-digits. And during bullish 2012 – 2017, they soared far above the market's +126.3%, reaching +181.9%.
This year, the portfolio features a player that thrives on volatility, an AI comer, and a dynamic tech company that helps doctors deliver better patient outcomes at lower costs.
See Stocks Today >>
General Motors Company (GM): Free Stock Analysis Report
American Axle & Manufacturing Holdings, Inc. (AXL): Free Stock Analysis Report
Cooper-Standard Holdings Inc. (CPS): Free Stock Analysis Report
Oshkosh Corporation (OSK): Free Stock Analysis Report
Original post
Zacks Investment Research