The Conference Board Leading Economic Index (LEI) for December was released this morning. The index increased 0.5 percent to 93.9 (2004 = 100), following no change in November, and a 0.3 percent increase in October. The Briefing.com consensus had correctly forecast the 0.5 percent increase. Today's press release puts the six-month growth rate well above last month's zero, thanks in large measure to some major improvements in the December data.
Here is the overview of today's release from the LEI technical notes:
The Conference Board LEI for the U.S. increased in December. Large positive contributions from initial claims for unemployment insurance (inverted) and financial components together with building permits offset negative contributions from consumer expectations and manufacturing new orders In the six-month period ending December 2012, the leading economic index increased 1.3 percent (about a 2.6 percent annual rate), much faster than the growth of 0.5 percent (about a 1.1 percent annual rate) during the previous six months. In addition, the strengths among the leading indicators have become somewhat more widespread. [Full notes in PDF format]
Here is a chart of the LEI series with documented recessions as identified by the NBER. 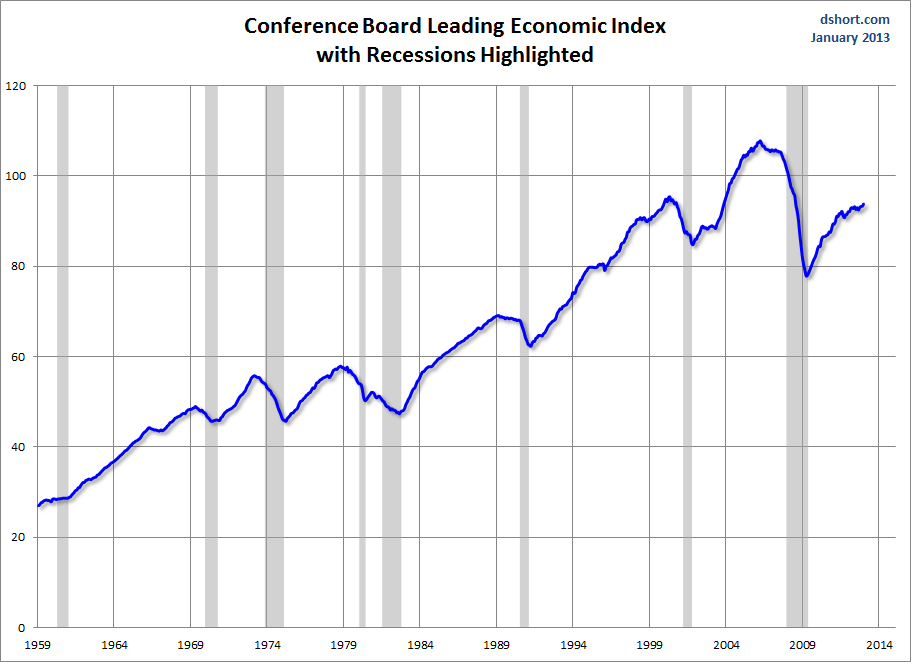
And here is a closer look at this indicator since 2000. We can more readily see that the recovery from the 2000 trough has been quite week in 2012.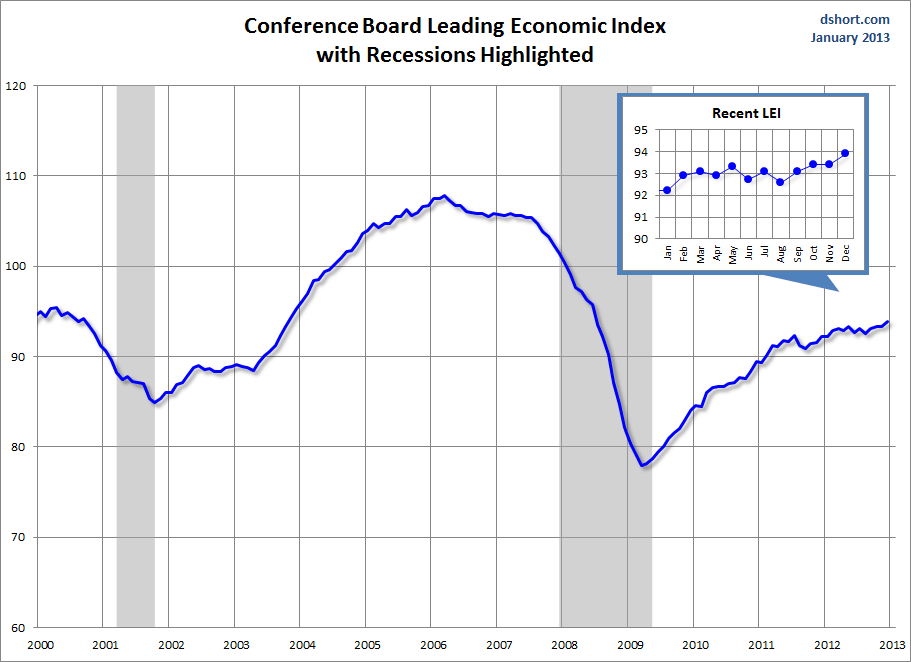
For a more details on the latest data, here is an excerpt from the press release:
Says Ataman Ozyildirim, economist at The Conference Board: "The U.S. LEI rose sharply in December, led by a large improvement in initial claims for unemployment insurance and positive contributions from the interest rate spread and the Leading Credit Index™. The increase in the LEI brought its six-month growth rate well above zero, with roughly two-thirds of the components advancing in the last six months. However, consumer expectations and manufacturers' new orders remain weak."
Says Ken Goldstein, economist at The Conference Board: "The latest data suggest that a pickup in domestic growth is now more likely, compared to a few months ago. Housing, which has long been a drag, has turned into a positive for growth, and will help improve consumer balance sheets and strengthen consumption. However, for growth to gain more traction we also need to see better performance on new orders and an acceleration in capital spending."
For a better understanding of the relationship between the LEI and recessions, the next chart shows the percentage off the previous peak for the index and the number of months between the previous peak and official recessions. 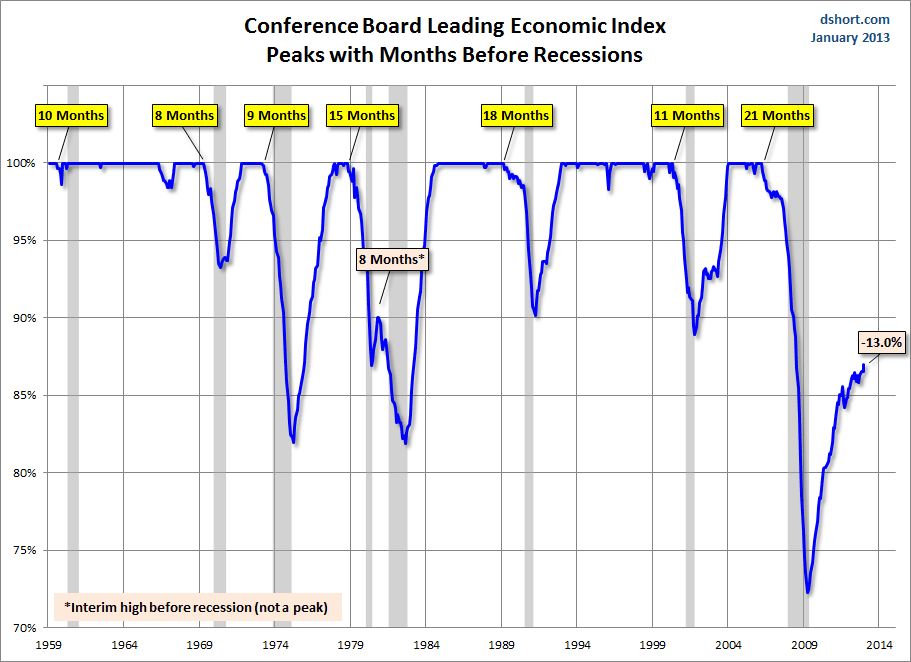
Here is a look at the rate of change, which gives a closer look at behavior of the index in relation to recessions.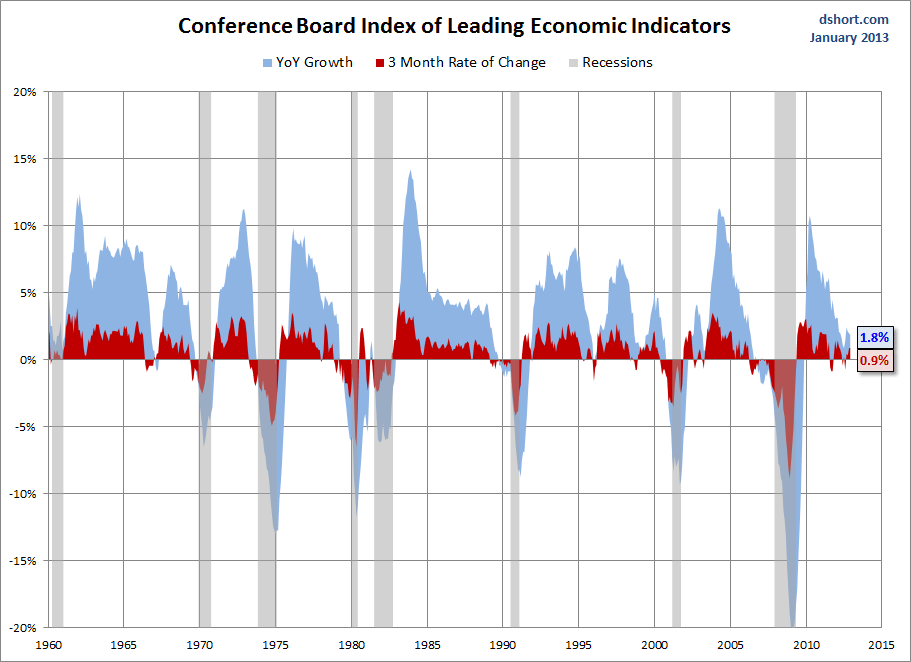
And finally, here is the same snapshot, zoomed in to the data since 2000.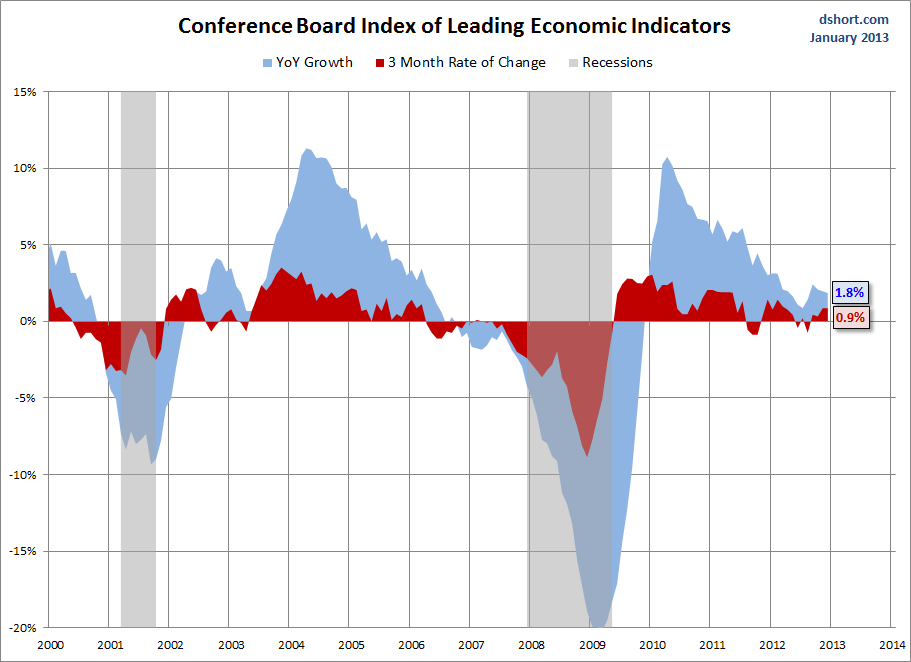
- English (UK)
- English (India)
- English (Canada)
- English (Australia)
- English (South Africa)
- English (Philippines)
- English (Nigeria)
- Deutsch
- Español (España)
- Español (México)
- Français
- Italiano
- Nederlands
- Português (Portugal)
- Polski
- Português (Brasil)
- Русский
- Türkçe
- العربية
- Ελληνικά
- Svenska
- Suomi
- עברית
- 日本語
- 한국어
- 简体中文
- 繁體中文
- Bahasa Indonesia
- Bahasa Melayu
- ไทย
- Tiếng Việt
- हिंदी
Conference Board Leading Economic Index: A Strong December
Published 01/25/2013, 12:42 AM
Updated 07/09/2023, 06:31 AM
Conference Board Leading Economic Index: A Strong December
3rd party Ad. Not an offer or recommendation by Investing.com. See disclosure here or
remove ads
.
Latest comments
Install Our App
Risk Disclosure: Trading in financial instruments and/or cryptocurrencies involves high risks including the risk of losing some, or all, of your investment amount, and may not be suitable for all investors. Prices of cryptocurrencies are extremely volatile and may be affected by external factors such as financial, regulatory or political events. Trading on margin increases the financial risks.
Before deciding to trade in financial instrument or cryptocurrencies you should be fully informed of the risks and costs associated with trading the financial markets, carefully consider your investment objectives, level of experience, and risk appetite, and seek professional advice where needed.
Fusion Media would like to remind you that the data contained in this website is not necessarily real-time nor accurate. The data and prices on the website are not necessarily provided by any market or exchange, but may be provided by market makers, and so prices may not be accurate and may differ from the actual price at any given market, meaning prices are indicative and not appropriate for trading purposes. Fusion Media and any provider of the data contained in this website will not accept liability for any loss or damage as a result of your trading, or your reliance on the information contained within this website.
It is prohibited to use, store, reproduce, display, modify, transmit or distribute the data contained in this website without the explicit prior written permission of Fusion Media and/or the data provider. All intellectual property rights are reserved by the providers and/or the exchange providing the data contained in this website.
Fusion Media may be compensated by the advertisers that appear on the website, based on your interaction with the advertisements or advertisers.
© 2007-2024 - Fusion Media Limited. All Rights Reserved.
