The Conference Board Leading Economic Index (LEI) for March was released this morning. The index declined 0.1 percent to 94.7 (2004 = 100), following a 0.5 increase in each of the two previous months. The Briefing.com consensus had forecast no change. Today's press release highlights the slow growth environment.
Here first is an overview of today's release from the LEI technical notes:
The Conference Board LEI for the U.S. declined slightly in March for the first time this year. Negative contributions from consumer expectations, building permits, ISM® new orders, average workweek in manufacturing and initial unemployment claims (inverted) offset the positive contributions from all the financial components and manufacturing new orders for both capital and consumer goods. In the six-month period ending March 2013, the index increased 1.6 percent (about a 3.2 percent annual rate), faster than the growth of 0.1 percent (about a 0.2 percent annual rate) during the previous six months. In addition, the strengths among the leading indicators have been widespread in recent months.
[Full notes in PDF format]
Here is a chart of the LEI series with documented recessions as identified by the NBER.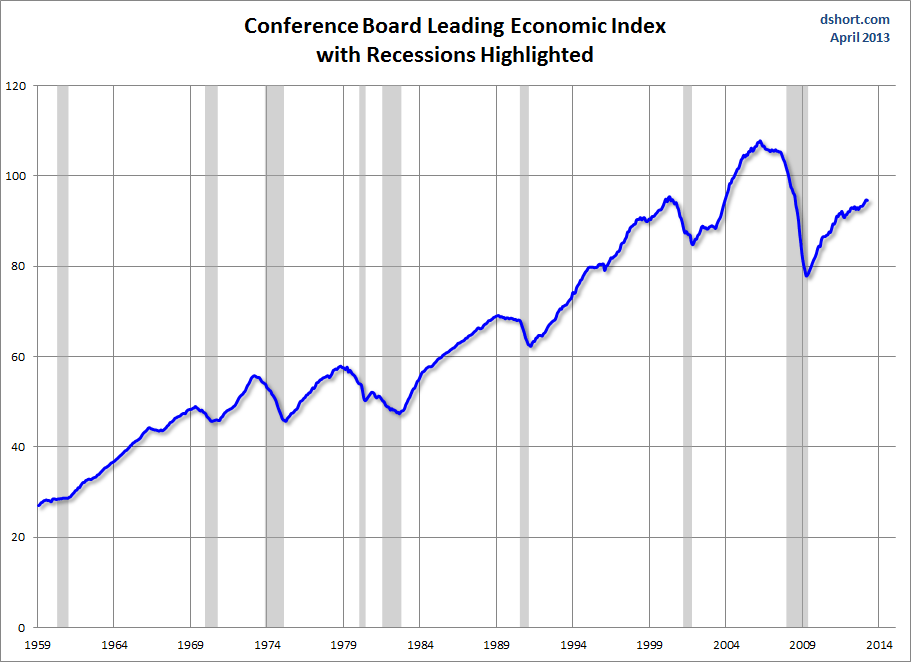
And here is a closer look at this indicator since 2000. We can more readily see that the recovery from the 2000 trough has been quite weak in 2012.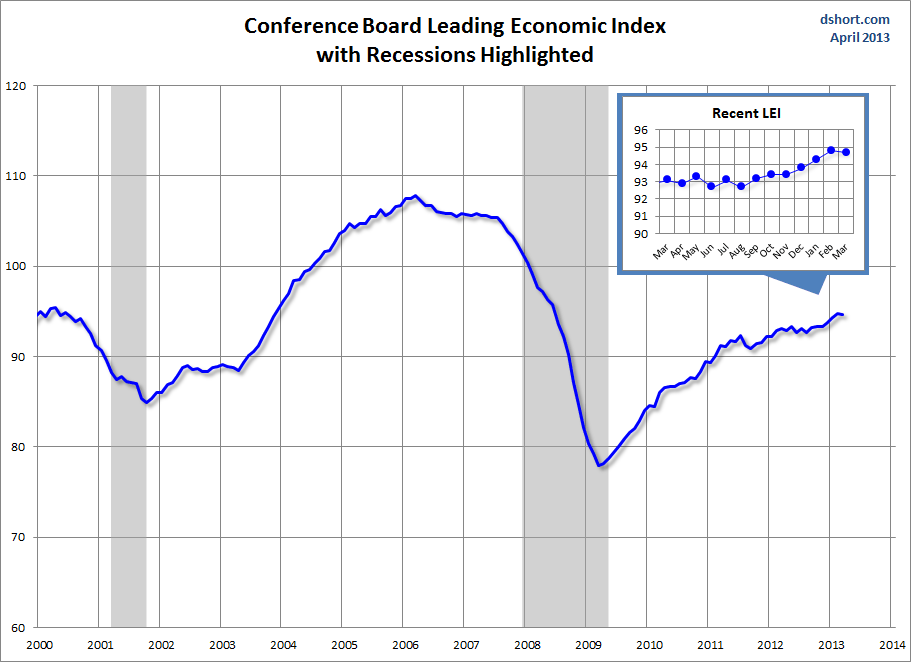
For a more details on the latest data, here is an excerpt from the press release:
Says Ataman Ozyildirim, economist at The Conference Board: "After three consecutive gains, the U.S. LEI dipped slightly in March, with equally balanced strengths and weaknesses among its components. The leading indicator still points to a continuing but slow growth environment. Weakness in consumer expectations and housing permits was offset by the positive interest rate spread and other financial components. Meanwhile, the coincident economic index, a measure of current conditions, is down since December due to a large decline in personal income."
Says Ken Goldstein, economist at The Conference Board: "Data for March reflect an economy that has lost some steam. In addition to headwinds from government spending cuts, the private sector economy may struggle to maintain its momentum. The biggest challenge remains weak demand, due to nervous consumer sentiment and slow income growth."
For a better understanding of the relationship between the LEI and recessions, the next chart shows the percentage off the previous peak for the index and the number of months between the previous peak and official recessions.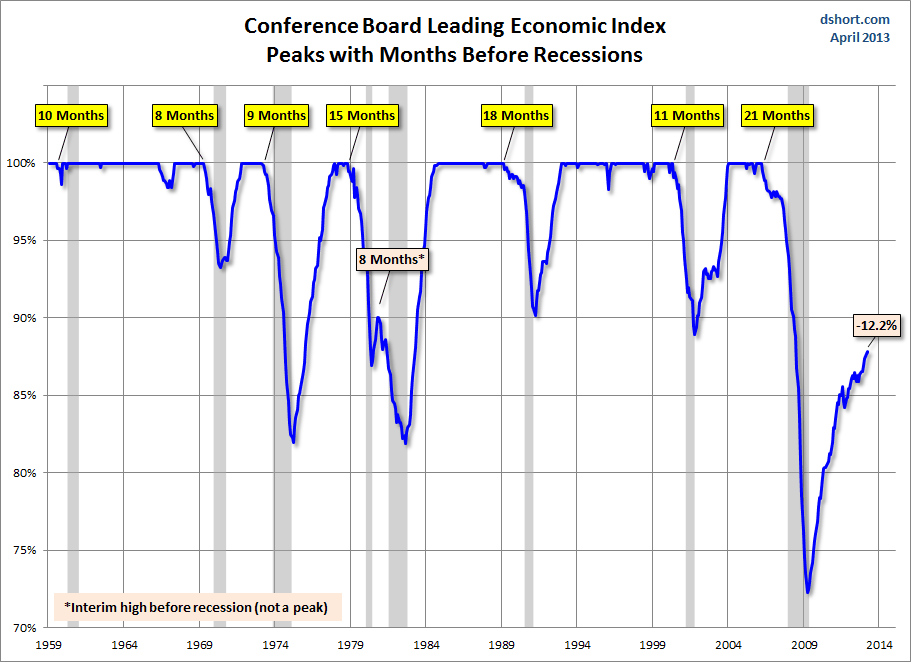
Here is a look at the rate of change, which gives a closer look at behavior of the index in relation to recessions.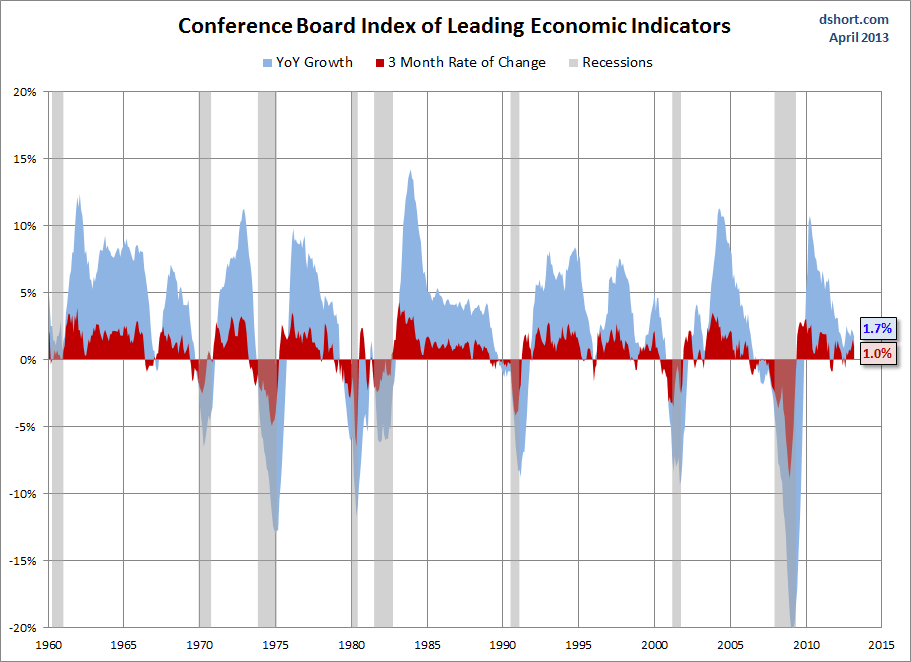
And finally, here is the same snapshot, zoomed in to the data since 2000.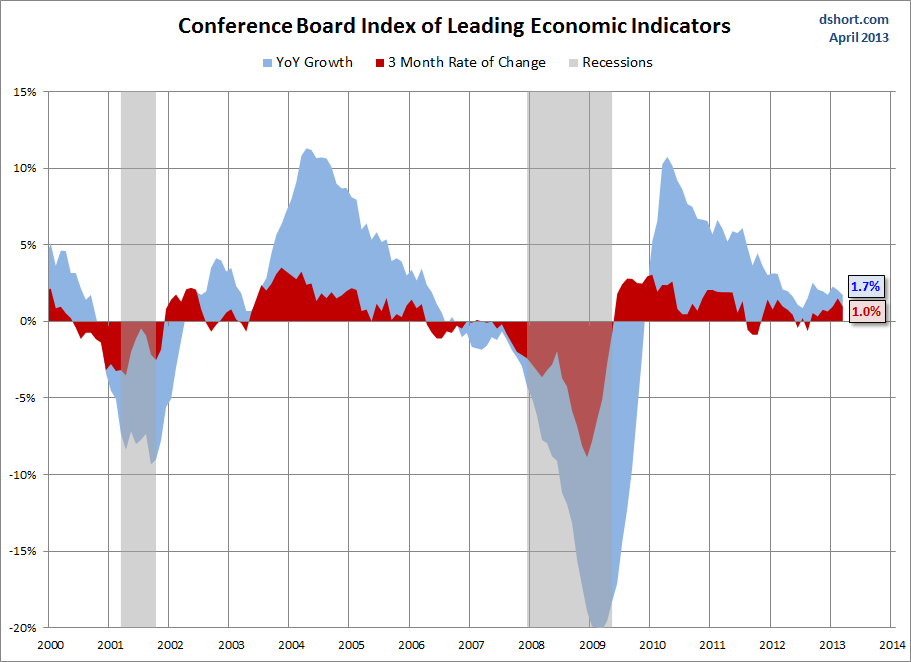
Check back next month for an updated analysis.
- English (UK)
- English (India)
- English (Canada)
- English (Australia)
- English (South Africa)
- English (Philippines)
- English (Nigeria)
- Deutsch
- Español (España)
- Español (México)
- Français
- Italiano
- Nederlands
- Português (Portugal)
- Polski
- Português (Brasil)
- Русский
- Türkçe
- العربية
- Ελληνικά
- Svenska
- Suomi
- עברית
- 日本語
- 한국어
- 简体中文
- 繁體中文
- Bahasa Indonesia
- Bahasa Melayu
- ไทย
- Tiếng Việt
- हिंदी
Conference Board Leading Economic Index: "Declined Slightly In March"
Published 04/19/2013, 01:06 AM
Updated 07/09/2023, 06:31 AM
Conference Board Leading Economic Index: "Declined Slightly In March"
3rd party Ad. Not an offer or recommendation by Investing.com. See disclosure here or
remove ads
.
Latest comments
Install Our App
Risk Disclosure: Trading in financial instruments and/or cryptocurrencies involves high risks including the risk of losing some, or all, of your investment amount, and may not be suitable for all investors. Prices of cryptocurrencies are extremely volatile and may be affected by external factors such as financial, regulatory or political events. Trading on margin increases the financial risks.
Before deciding to trade in financial instrument or cryptocurrencies you should be fully informed of the risks and costs associated with trading the financial markets, carefully consider your investment objectives, level of experience, and risk appetite, and seek professional advice where needed.
Fusion Media would like to remind you that the data contained in this website is not necessarily real-time nor accurate. The data and prices on the website are not necessarily provided by any market or exchange, but may be provided by market makers, and so prices may not be accurate and may differ from the actual price at any given market, meaning prices are indicative and not appropriate for trading purposes. Fusion Media and any provider of the data contained in this website will not accept liability for any loss or damage as a result of your trading, or your reliance on the information contained within this website.
It is prohibited to use, store, reproduce, display, modify, transmit or distribute the data contained in this website without the explicit prior written permission of Fusion Media and/or the data provider. All intellectual property rights are reserved by the providers and/or the exchange providing the data contained in this website.
Fusion Media may be compensated by the advertisers that appear on the website, based on your interaction with the advertisements or advertisers.
© 2007-2024 - Fusion Media Limited. All Rights Reserved.
