An e-mail from one of my Blog readers this weekend inspired me to write about the following...so, first of all, thank you, kind reader, for writing.
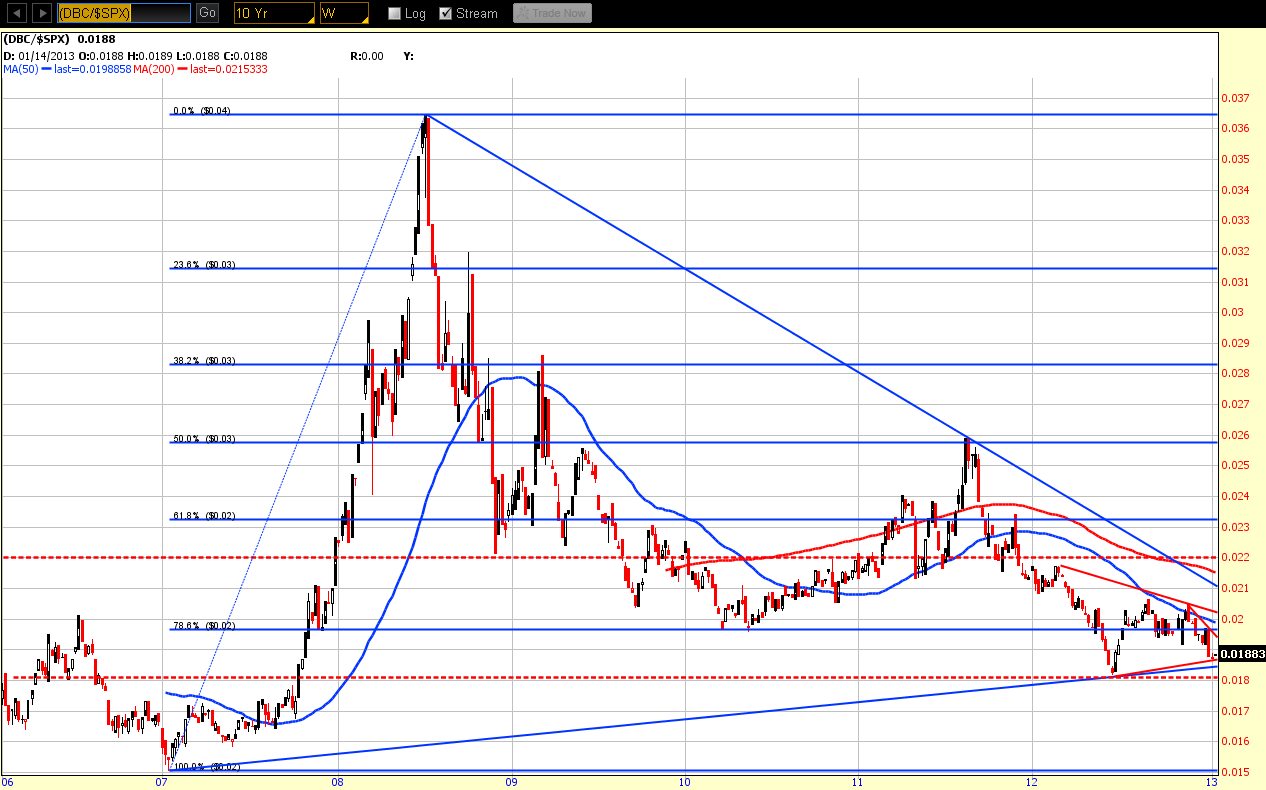
With price sitting just above a major uptrend line from the 2007 lows, as well as horizontal price support, this Weekly ratio chart of DBC:SPX shows that price may be due for a bounce on DBC, the Commodities ETF. If price can rally, break and hold above, firstly 0.02 where there is a convergence of resistance of the 50 SMA (blue), 78.6% Fibonacci retracement level, and a short-term downtrend line, it has a chance to reach the 0.022 level, which is currently sitting just above the 200 SMA (red), and, potentially, the 61.8% Fibonacci retracement level just above 0.023, or higher.
If equities weaken, we may see this scenario occur. However, we could also see cash flowing into both equities and commodities. It may be that money is/will be flowing out of Bonds to fund such activity. I last wrote about 30-Year Bonds in my post of January 18th. They are worth tracking over the next week(s). With the Fed busy buying Bonds, it may be difficult to determine how much private money is flowing out of them. Time will tell, as may the charts.
One thing that may provide a clue on this is if we see increased buying volumes on equities and commodities and increased selling volumes on Bonds.
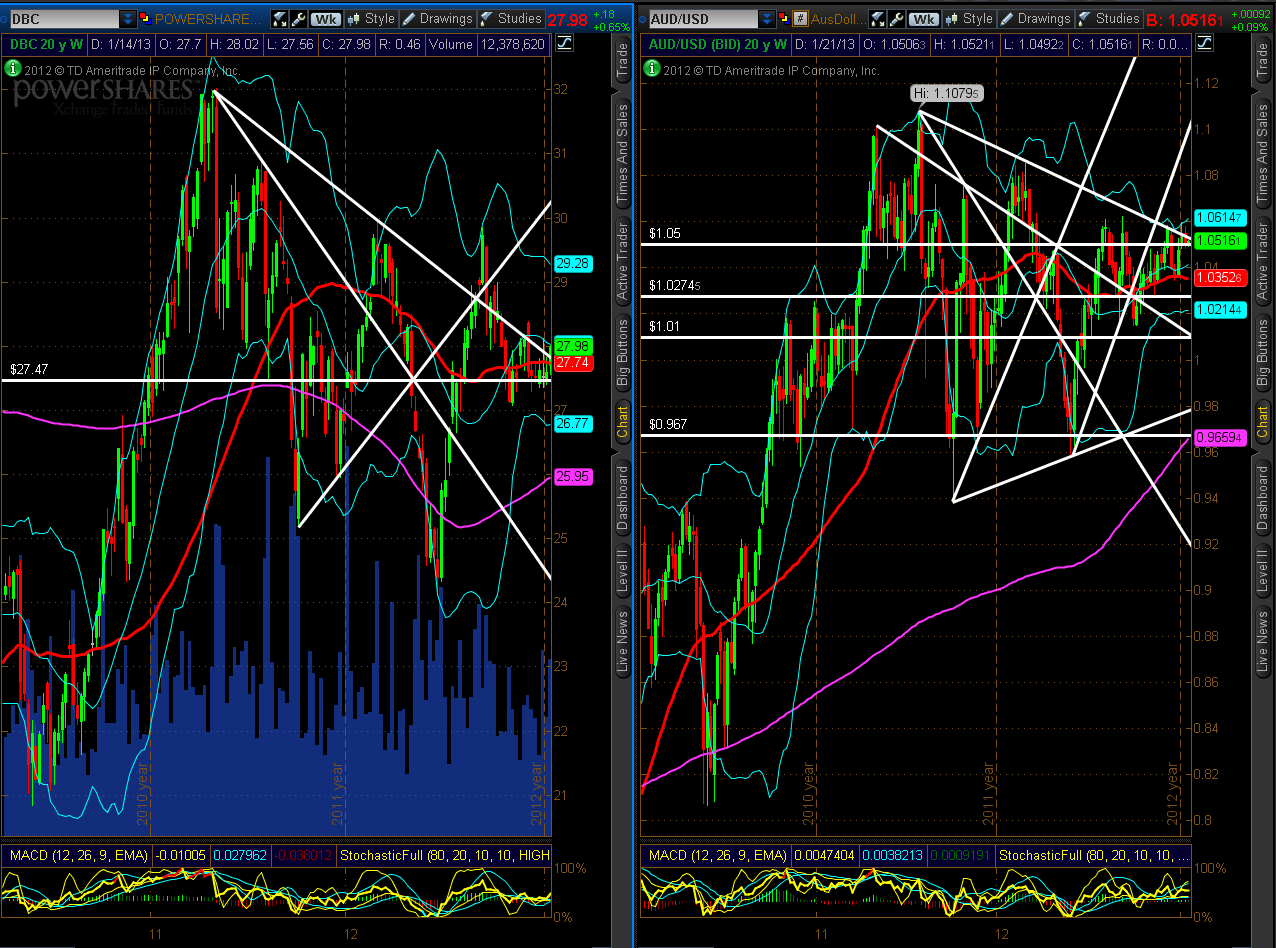
Below are Weekly charts of DBC and the AUD/USD Forex pair. DBC has broken above a medium-term downtrend line and is sitting at its mid-Bollinger Band, and volumes have increased recently. AUD/USD looks poised for a breakout above its medium-term downtrend line. Two currencies to watch to confirm the above potentially bullish scenario for Commodities, in general.
I also wrote about the U.S. dollar in the above-referenced post. That's also one to watch, along with volumes, to see whether the dollar weakens considerably to support such an equity/commodity-buying scenario.
As well, my last post outlined a bullish scenario for Platinum and Gold. They are two commodities to watch to confirm any general bullishness in Commodities, as I've described above.
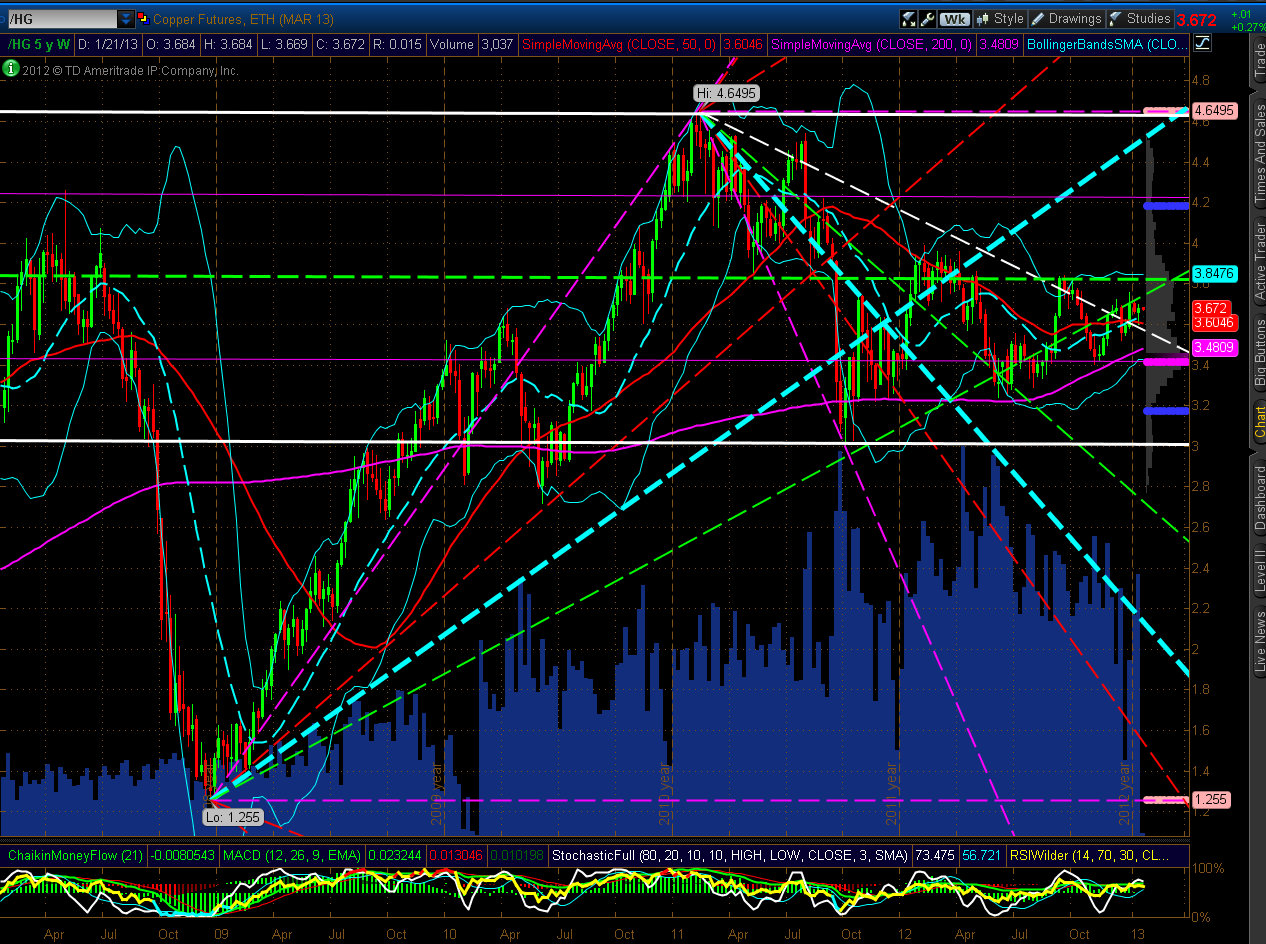
The Weekly chart below of Copper shows that it, too, is poised for a breakout, one way or the other.
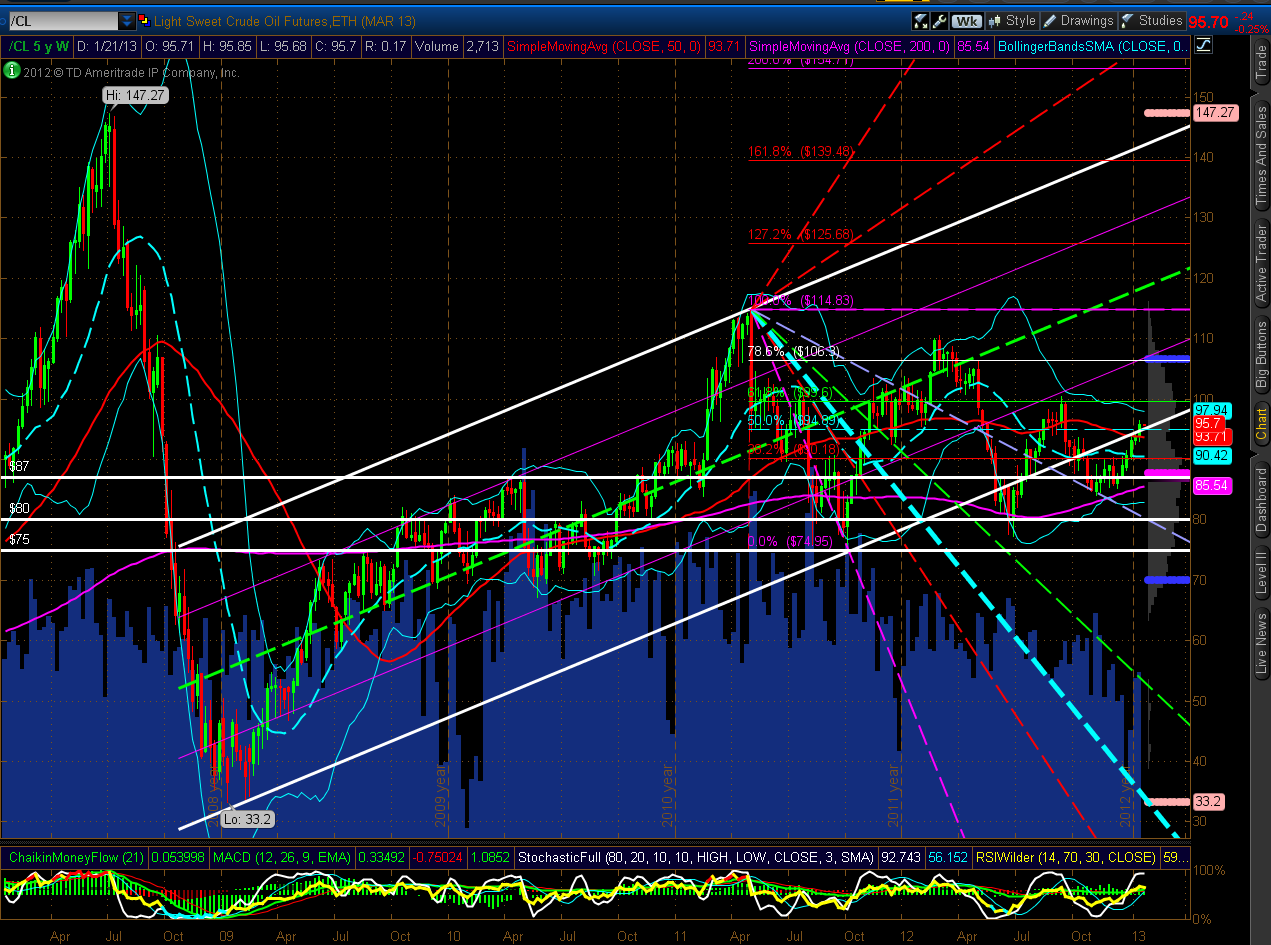
Lastly, the Weekly chart below of Oil shows that, if price can remain within its large rising channel, it has a chance of reaching 100, or higher.
Conversely, any near-term meaningful weakening in DBC, AUD/USD, Platinum, Gold, Copper, and Oil may also negatively influence equities.
As I described in my post of January 18th, we may see an increase in volatility soon due to extreme overbought Stochastics levels (on a Weekly timeframe) in equities, and further hedge-buying in 30-Year Bonds and the U.S. dollar. I also wrote about stocks being at their extreme overbought levels in my post of January 19th.
Increasing volumes may hold the key in determining/confirming the seriousness and sustainability of any pullback or breakout.
- English (UK)
- English (India)
- English (Canada)
- English (Australia)
- English (South Africa)
- English (Philippines)
- English (Nigeria)
- Deutsch
- Español (España)
- Español (México)
- Français
- Italiano
- Nederlands
- Português (Portugal)
- Polski
- Português (Brasil)
- Русский
- Türkçe
- العربية
- Ελληνικά
- Svenska
- Suomi
- עברית
- 日本語
- 한국어
- 简体中文
- 繁體中文
- Bahasa Indonesia
- Bahasa Melayu
- ไทย
- Tiếng Việt
- हिंदी
Commodities Poised For A Bounce?
Published 01/21/2013, 12:48 AM
Updated 07/09/2023, 06:31 AM
Commodities Poised For A Bounce?
3rd party Ad. Not an offer or recommendation by Investing.com. See disclosure here or
remove ads
.
Latest comments
Install Our App
Risk Disclosure: Trading in financial instruments and/or cryptocurrencies involves high risks including the risk of losing some, or all, of your investment amount, and may not be suitable for all investors. Prices of cryptocurrencies are extremely volatile and may be affected by external factors such as financial, regulatory or political events. Trading on margin increases the financial risks.
Before deciding to trade in financial instrument or cryptocurrencies you should be fully informed of the risks and costs associated with trading the financial markets, carefully consider your investment objectives, level of experience, and risk appetite, and seek professional advice where needed.
Fusion Media would like to remind you that the data contained in this website is not necessarily real-time nor accurate. The data and prices on the website are not necessarily provided by any market or exchange, but may be provided by market makers, and so prices may not be accurate and may differ from the actual price at any given market, meaning prices are indicative and not appropriate for trading purposes. Fusion Media and any provider of the data contained in this website will not accept liability for any loss or damage as a result of your trading, or your reliance on the information contained within this website.
It is prohibited to use, store, reproduce, display, modify, transmit or distribute the data contained in this website without the explicit prior written permission of Fusion Media and/or the data provider. All intellectual property rights are reserved by the providers and/or the exchange providing the data contained in this website.
Fusion Media may be compensated by the advertisers that appear on the website, based on your interaction with the advertisements or advertisers.
© 2007-2024 - Fusion Media Limited. All Rights Reserved.
