In this week's Commodities Corner Update, I want to pay specific attention to a potential technical confluence trade that may be developing. Oftentimes in markets one of the premium confirmations for entering a market is when correlated markets start to sync up around technical levels at the same time.
In the Commodity and Commodity FX space we may be witnessing the emergence of one of these confluence opportunities. Currently we are witnessing pull backs in three correlated instruments - crude, AUD/USD and USD/CAD - all of which are about to test near-term trend continuation inflection points. Lets take a look at each individual chart and get a visual representation of the inflection points.
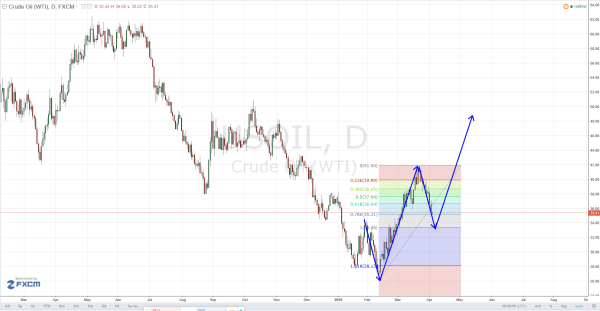
In the crude chart we have seen a violent short-covering rally from the February lows. The confluence trade relies upon this move off the lows representing the first leg wave of what should ideally prove to be a three wave correction to the dominant downtrend. The price pivot I am watching in crude is $33.50. This level represents a potential symmetry support level and broadly coincides with a 50% retracement of the move from the February lows to the March highs. If this level attracts buyers, then this sets a support platform for a third wave higher in crude, targeting the mid to late $40s into the summer as per the chart below.

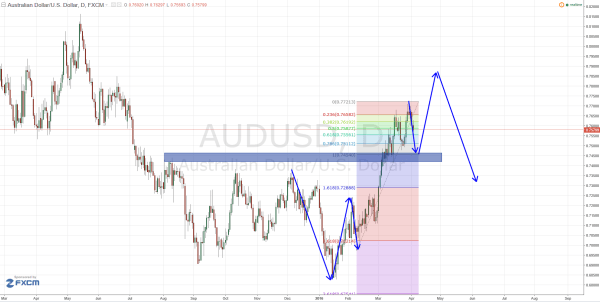
The Aussie has also witnessed a distinct turn in fortunes from its early January lows, and and has pushed up over the key technical hurdle of .7500. Over the past couple of session it pulled back from the .7700 level. In line with crude, the Aussie should ideally find support at the .7450 level, which represents a price and time symmetry support level as highlighted in the chart below. If this level attracts buyers to step back in, then this level will set a support platform for the Aussie to surge higher to potentially test the psychological .8000 level.

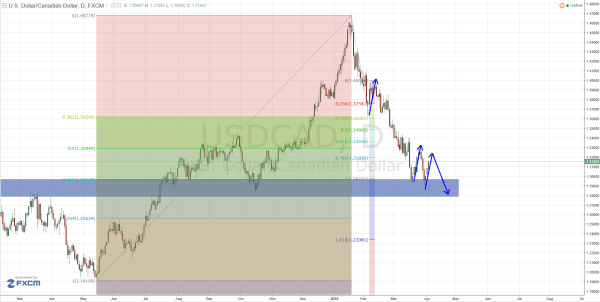
The third leg to the commodities confluence trade stool is the loonie. The loonie has been in a precipitous and prolonged decline and is currently correcting the last leg lower from the structural support sited at the 1.2850 level. Ideally this current bounce will run into resistance at the 1.3230 area, which represents a symmetry swing correction in the downtrend. This level attracts fresh sellers, so we can anticipate at a minimum a retest of the current cycle lows, with the potential for something more significant which I will highlight in later reports. In the near-term the critical resistance to watch for a reversal is the 1.3230/50 level.

As always, it is essential to watch for intraday confirmations of the support levels highlighted before entering trades at these levels.
