
The US dollar has encountered some selling pressure, following its massive breakout. Remarkably, it hasn’t had a losing month since last summer. These types of powerful trends are almost always driven by fundamentals. Briefly, these fundamentals include growth differentials between the US and Europe, interest rate differentials, and differing stages of monetary policy.
Essentially, Europe and Japan are still loosening monetary policy in order to help the economy heal, while the US is considering interest rate hikes. Now as the chart below shows, the dollar looks overbought and there are good reasons to expect some sort of consolidation or pullback. And there are some clues that we may be in the midst of one.
The dollar pierced its $100 level which brought it all the way back to 2002 highs. Sentiment surveys indicate excess bullishness towards the dollar based on how traders and speculators are positioned. Inverse positions like commodities and the euro share equal extremes in terms of bearish sentiment.
However, the fact of the matter is that sentiment has been particularly bullish for some time. It is not an effective timing indicator (how many traders use it) but more as an indication that the counter trend move could be particularly vicious. In the face of extreme sentiment, traders on both side should pay attention more to risk.
While traders and speculators may be long the dollar by an impressive amount, most of the world has been short in dollars and borrowing in dollars. The more the dollar goes up, the more pain they feel. This unwinding is impervious to sentiment or anything to do with the positioning of traders with sums in the billions of dollars versus forces that have borrowed in dollars to the tune of trillions of dollars.
These are all reasons to be bullish on the dollar longer term, but shorter term this looks like a good place to make that counter trend trade. Some catalysts are recent soft data in the US and earnings data in Europe which is better than expected. Pickup in inflation but a more dovish Fed than anticipated at the beginning of the year.
The best way to play a retracement in the dollar would be in the beaten down commodity sector. Many of these stocks are priced for bankruptcy with huge short ratios. This situation could unleash massive oversold rallies.
Dry bulk shipping is related to commodities, especially iron ore which has been very weak in recent months, falling below $50/ton. Due to these pressures, Baltic Trading Limited (NYSE:BALT) has fallen precipitously in 2015. The chart pattern is showing a low risk entry that has the potential to break higher if commodities catch a bid.
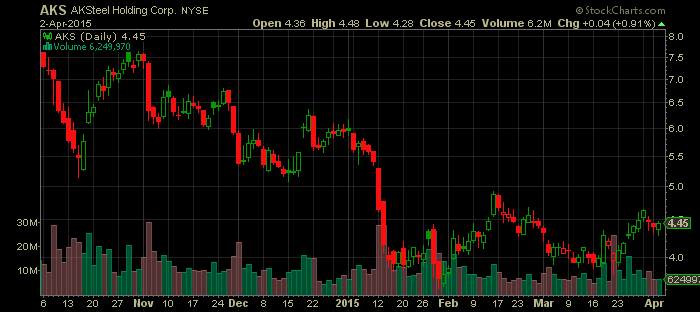
The drop in iron ore prices is actually a positive omen for steel stocks as that is their largest input price. AK Steel Holding Corporation (NYSE:AKS) after dropping hard in the first few days of 2015, has been building a decent base with a double bottom. As long as this double bottom holds, one can be bullish on this stock.
- English (UK)
- English (India)
- English (Canada)
- English (Australia)
- English (South Africa)
- English (Philippines)
- English (Nigeria)
- Deutsch
- Español (España)
- Español (México)
- Français
- Italiano
- Nederlands
- Português (Portugal)
- Polski
- Português (Brasil)
- Русский
- Türkçe
- العربية
- Ελληνικά
- Svenska
- Suomi
- עברית
- 日本語
- 한국어
- 简体中文
- 繁體中文
- Bahasa Indonesia
- Bahasa Melayu
- ไทย
- Tiếng Việt
- हिंदी
Commodities Catch Bid As Dollar Takes Breather
Published 04/02/2015, 10:23 PM
Updated 07/09/2023, 06:32 AM
Commodities Catch Bid As Dollar Takes Breather


3rd party Ad. Not an offer or recommendation by Investing.com. See disclosure here or
remove ads
.
Latest comments
Install Our App
Risk Disclosure: Trading in financial instruments and/or cryptocurrencies involves high risks including the risk of losing some, or all, of your investment amount, and may not be suitable for all investors. Prices of cryptocurrencies are extremely volatile and may be affected by external factors such as financial, regulatory or political events. Trading on margin increases the financial risks.
Before deciding to trade in financial instrument or cryptocurrencies you should be fully informed of the risks and costs associated with trading the financial markets, carefully consider your investment objectives, level of experience, and risk appetite, and seek professional advice where needed.
Fusion Media would like to remind you that the data contained in this website is not necessarily real-time nor accurate. The data and prices on the website are not necessarily provided by any market or exchange, but may be provided by market makers, and so prices may not be accurate and may differ from the actual price at any given market, meaning prices are indicative and not appropriate for trading purposes. Fusion Media and any provider of the data contained in this website will not accept liability for any loss or damage as a result of your trading, or your reliance on the information contained within this website.
It is prohibited to use, store, reproduce, display, modify, transmit or distribute the data contained in this website without the explicit prior written permission of Fusion Media and/or the data provider. All intellectual property rights are reserved by the providers and/or the exchange providing the data contained in this website.
Fusion Media may be compensated by the advertisers that appear on the website, based on your interaction with the advertisements or advertisers.
© 2007-2024 - Fusion Media Limited. All Rights Reserved.