The annual return of investors and traders after weeks of hibernation has caused the usual chasing after potential profitable trades. Fresh money has been put to work and the energy sector and precious metals have so far been the main recipients as improved economic data, especially from the US, and not least the threat of conflict in the Persian Gulf has lifted oil prices and triggered renewed safe haven buying of gold and silver. Also included in this week’s report are our views on the outlook for the first quarter.
Next week attention will focus on the annual rebalancing of the world’s two most followed commodity benchmarks, the Dow Jones-UBS Commodity Index (DJ-UBS CI) and the S&P GSCI Commodity Index (S&P GSCI). It is estimated that between USD 250 billion and USD 300 billion is invested directly or benchmarked against these two indices and it will be an important focus over the next couple of weeks as investor flows across underlying commodity futures can be quite significant.
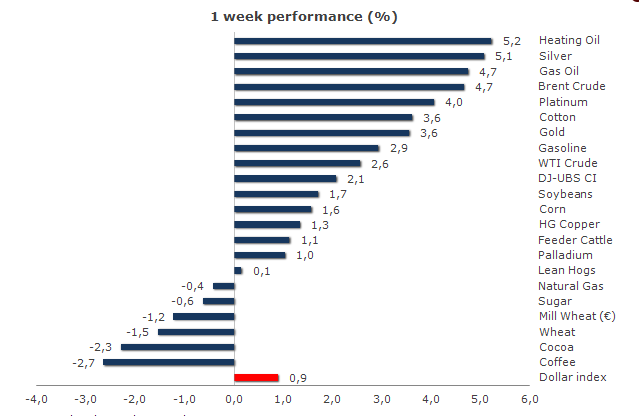
A quick look at the performance table for the first week of 2012 reveals the DJ-UBS index returning a healthy 2 percent primarily helped by gains in energy and precious metals. Soft commodities have generally been struggling and wheat prices on both sides of the Atlantic succumbed to profit taking following a strong end of year rally.
2012 index rebalancing
Each January, both the DJ-UBS CI and the S&P GSCI indices alter their current exposure of their baskets to bring them back to their original fundamental target weights and to allow for any new adjustments. The rebalancing is mostly but not exclusively a matter of selling the previous year’s outperformers and buying the underperformers to bring the portfolio composure back in line. This year we have an added twist, with Brent crude being added to the DJ-UBS index for the first time and WTI crude seeing its weight being reduced by a similar amount.
The settlement price on 6 January will determine the final amount of contracts to be bought and sold with the actual exercise taking place from Monday 9 January to Friday 13 January. Some 20 percent of the rebalancing size will be adjusted each day using the futures contracts’ closing prices on that day.
Broadly speaking, agriculture, livestock and industrials will be bought while precious metals and energy will be sold with the exception of natural gas and the above mentioned Brent crude contract. It may potentially have an upside price impact on sugar, nickel, cotton, wheat and zinc as the estimated rebalancing size required represents a significant portion of the available liquidity of each commodity. Signs that traders had tried to preempt this buying was seen Thursday when sugar dropped 5.2 percent, the most since September, as fundamental news caused the price to drop and then be exacerbated by speculators who were forced to close long positions.
With the S&P GSCI also reducing its exposure to WTI crude to the benefit of Brent crude and gas oil the total amount of WTI crude that needs to be sold is estimated at above USD 15 billion against more than USD 5 billion being bought in Brent crude. Although significant these amounts are still relatively small compared to the daily average volumes but have nevertheless helped trigger a significant outperformance of Brent crude this week. The spread has widened by 3 dollars over the last week to above 11 dollars indicating that traders and fund managers, who tracks the DJ-UBS, have been active already ahead of the big trades next week.
Extracts from Q1 outlook: Commodity markets braced for headwinds
The first quarter will most likely produce a great amount of uncertainty as the market will be looking for clarity on many of the unanswered questions left from 2011, especially the all-important unknown of whether we will face another global recession in 2012.
With our expectations for further dollar appreciation during the early stages of 2012, the upside for the major commodity indices seems to be limited during the first quarter with investors likely to be very selective.
Precious metals like gold and to certain extent silver will continue to benefit from continued risk aversion. Supporting factors also include the negative yield environment, currently seen among more than half of the G20 nations, combined with strong physical demand from central banks and emerging market investors. We see prices stabilising after a late 2011 correction with fresh investment flows driving the price towards 1,800 during Q1 and even higher later in the year.
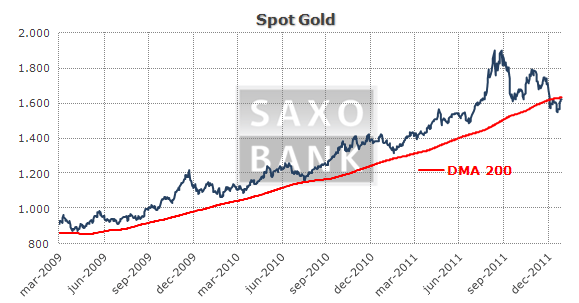
Technical update: the rally from the lows has put gold in a much better near-term situation with a close above the 200-day moving average at 1,634 signalling further upside potential. Only a weekly close below 1,545 would shatter this projection and lead to a deeper correction.
Base metals will, despite a deteriorating outlook for new supply, continue to struggle through the early parts of 2012 on growing concern of a recession in developed markets, combined with emerging markets slowing down. The long-term prospect however remains positive as lower prices should meet restocking demand, especially from countries like China.
The agricultural sector suffered a major setback during 2011 on a combination of normalised weather and farmers across the globe reacting to the high prices during 2010/11 by planting record amounts of new crop. The accumulative speculative long position held by hedge funds across the sector has fallen to the lowest level in two and half years and on that basis (combined with the potential challenges of weather related supply issues as currently unfolding in South America) we see good potential for higher prices, especially among commodities with constrained supply, such as corn and soybeans.
The energy sector, excluding US natural gas which is stuck in a bear market amid ample US supply from shale gas, looks set to remain range-bound during the early parts of 2012. The two greatest risks to oil prices are an escalation of tensions around the Persian Gulf (Iran and Iraq) to the upside and a worsening of the crisis in the Eurozone on the downside.
Brent crude has the potential of making a low around 95 dollars and should average 100 dollars during Q1 before rising later in the year. I would estimate that the risk premium and speculative buying ahead of next week’s rebalancing, which would benefit Brent crude, have added around 10 dollars to the current price. Only brave hearts would go against the current move with the risk of a short-term spike looming but look out for any news that points towards an easing of the tensions as it could trigger some aggressive selling.
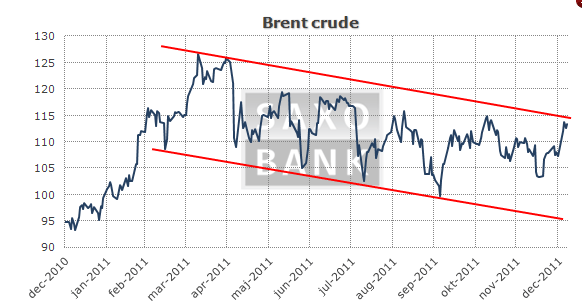
Technical update: the trend line and previous high closes will provide resistance at 115 ahead of the September and November high at 116.50. Support can be found at 111.50 ahead of 110.00.
- English (UK)
- English (India)
- English (Canada)
- English (Australia)
- English (South Africa)
- English (Philippines)
- English (Nigeria)
- Deutsch
- Español (España)
- Español (México)
- Français
- Italiano
- Nederlands
- Português (Portugal)
- Polski
- Português (Brasil)
- Русский
- Türkçe
- العربية
- Ελληνικά
- Svenska
- Suomi
- עברית
- 日本語
- 한국어
- 简体中文
- 繁體中文
- Bahasa Indonesia
- Bahasa Melayu
- ไทย
- Tiếng Việt
- हिंदी
Commodities Boom –For Now
Published 01/06/2012, 11:30 AM
Updated 03/19/2019, 04:00 AM
Commodities Boom –For Now
Latest comments
Loading next article…
Install Our App
Risk Disclosure: Trading in financial instruments and/or cryptocurrencies involves high risks including the risk of losing some, or all, of your investment amount, and may not be suitable for all investors. Prices of cryptocurrencies are extremely volatile and may be affected by external factors such as financial, regulatory or political events. Trading on margin increases the financial risks.
Before deciding to trade in financial instrument or cryptocurrencies you should be fully informed of the risks and costs associated with trading the financial markets, carefully consider your investment objectives, level of experience, and risk appetite, and seek professional advice where needed.
Fusion Media would like to remind you that the data contained in this website is not necessarily real-time nor accurate. The data and prices on the website are not necessarily provided by any market or exchange, but may be provided by market makers, and so prices may not be accurate and may differ from the actual price at any given market, meaning prices are indicative and not appropriate for trading purposes. Fusion Media and any provider of the data contained in this website will not accept liability for any loss or damage as a result of your trading, or your reliance on the information contained within this website.
It is prohibited to use, store, reproduce, display, modify, transmit or distribute the data contained in this website without the explicit prior written permission of Fusion Media and/or the data provider. All intellectual property rights are reserved by the providers and/or the exchange providing the data contained in this website.
Fusion Media may be compensated by the advertisers that appear on the website, based on your interaction with the advertisements or advertisers.
© 2007-2024 - Fusion Media Limited. All Rights Reserved.
