As the rollercoaster ride of 2011 comes to an end I finish off my weekly series of commodity updates for the year by taking a look at what influenced the performance among sectors and some individual commodities and peering though a crystal ball for signs of what lies in store for us during the early part of 2012.
After a strong performance during the first four months risk adversity returned, giving way to general weakness and the S&P GSCI commodity index headed for the first (small) annual drop since 2008. Other major indexes such as the DJ UBS ended down more than 13 percent due to its much bigger exposure to the two major sectors suffering the biggest casualties: agriculture and industrial metals. Meanwhile the Reuters Jefferies CRB index, which we tend to use in our weekly comments, ended around 8 percent lower, much in line with the MSCI world stock index. 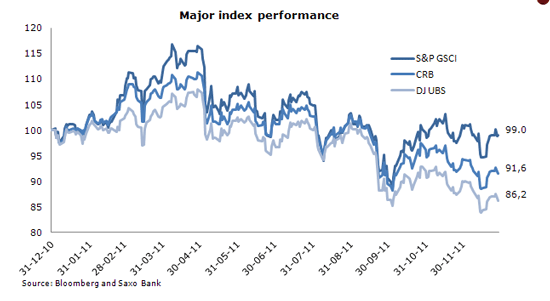
The overall loss of one percentage point on the S&P GSCI commodity index hides substantial differences between the four subsectors. Positive returns were seen among energy and precious metals while the hardest hit were industrial metals followed by agriculture. The relatively decent performance of the overall index can be explained by the fact that the top two sectors comprise 70 percent of the S&P GSCI index.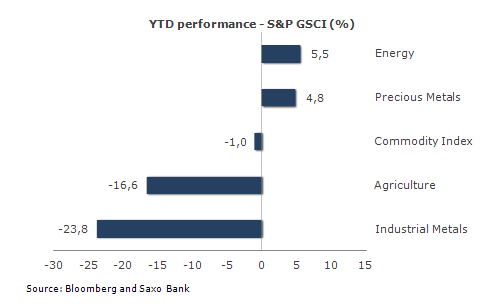
Taking a look at the individual commodities we see big differences in performance with energy related products representing more than half of the profitable markets and gold, which for a long time occupied the top slot before renewed selling during December, saw a modest performance of just 10 percent. At the bottom we find some of the market’s hardest hit: by either slowing economic activity, such as carbon, cotton and copper or oversupply as highlighted by natural gas and cocoa.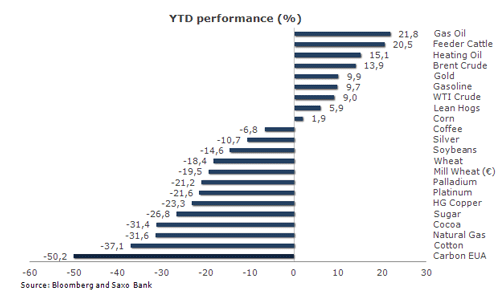
Energy
2011 was a year where the global consumer had to get used to oil prices above 100 dollars, with Brent crude averaging 110 dollars during the year, some 37 percent above 2010. This increased “tax” on the global consumer played its part in changing the outlook for 2011 as early expectations about increased economic growth ran into the sand and was replaced by renewed worries about recession.
Brent crude reached a peak of 127 dollars per barrel back in April when worries about the loss of Libyan oil were the main focus. What followed was a steady but very slow decline as focus shifted towards a stronger dollar and the sovereign debt crisis in Europe, which after two years remains unsolved.
As we moved into 2012 heightened geopolitical risk, due to Syria and Iran combined with signs of an improving US economy will support prices while concerns about the overall global economy and the crisis in the Eurozone will pull in the other direction. The dollar will continue to play a very important part in deciding which side to bet on and with speculators already holding a near record short EUR long USD position. Any change in sentiment could trigger dollar selling which in turn would support commodities, at least short term.
We continued to see Brent crude being stuck between 100 and 115 in the months ahead as the opposing factors mentioned above will keep it in a relatively tight range.
Precious metals
The combination of strong fundamentals and investor involvement drove gold to a new nominal record back in September. But as the dollar surged and leveraged investment made it more expensive to hold gold, it finally succumbed to a dramatic correction, one that it has struggled to recover from ever since.
The supporting factors, which include buying from central banks - mainly in Asia and the Middle East - the prospect of sustained low or negative real interest rates in the US and the potential for a further deterioration of the crisis in Europe will continue and should help gold outperform the dollar in 2012.
For now though the performance very much hinges on when and if “hot money” from speculators and “real money” from money managers will find its way back into the market. The world’s two biggest consumers China and India have scaled back purchases recently as China restricted spot and futures trading to the two main exchanges in Shanghai only in order to clamp down on illegal buying and selling of commodities. India’s imports have been hampered by a plunge in the Rupee which leaves the price of gold in local currency up one third in the year.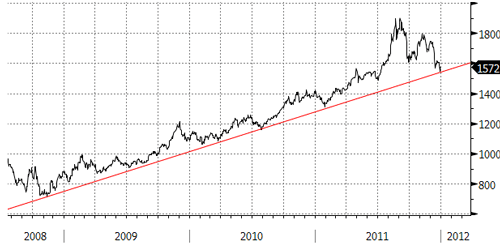
The failure during the last couple of weeks to move decidedly back above the 200-day moving average, currently at 1,628 could indicate that a further setback is required before the above mentioned buyers return to the market. I will be keeping a close eye on the uptrend from the 2008 low with a weekly close below 1,540 signalling the risk for further losses before proper support can be established. This coincides with 1,537 being the level below what would signal that gold has entered into a technical bear market defined as a 20 percent drop from a recent high.
Silver remains the volatile and temperamental youngster and as such cannot compete as a safe haven. However after having corrected 50 percent of the 2008 to 2011 rally it has moved back to the five-year average ratio to gold. On that basis it would become a good relative play once economic activity begins to show signs of bottoming or improving.
Industrial metals
As the global economic outlook began to deteriorate during the second half of 2011 so did the outlook for industrial metals. The LME Index of six industrial metals dropped 23 percent, led by declines in tin, nickel and zinc. The price of copper which had more than tripled from the 2009 low went into reverse as doubt about the growth outlook for especially China began to surface. With China consuming close to 40 percent of industrial metals a slowdown would hurt the sector more than ex oil prices (China only consumes around 10 percent of global oil production).
A meltdown as experienced during 2008 however seems remote as several supply problems and disruptions remain and the worry persists that once the economic activity picks up again prices will be supported as the focus will swiftly turn back to supply. The economic outlook for the US, the world’s second-largest consumer, is showing signs of improving and should also help cushion any additional weakness. Copper’s poor performance this year was heavily influenced by a lack of Chinese buying due to high prices, tight monetary policy and not least the drawing down of excess stocks that had been built up over the previous two years. A move from de- to restocking alone could support prices so the outlook for copper looks better than other industrial metals due to its scarce supply.
Agriculture
The record high prices of agricultural products in 2010/11 was met by a massive response by farmers across the globe who, assisted by much improved weather conditions, planted record amounts of crop leading to much improved inventory levels and subsequent lower prices. The higher cost of food which saw the UN FAO food price index rise by 68 percent from 2009 to the peak in February 2011 helped trigger the Arab Spring uprising before the above mentioned response from farmers began to lower prices.
Only corn managed to show a positive return on the year with cocoa and sugar suffering the most after increased production failed to be met by higher demand as Europe especially moved towards recession and the dollar strengthened.
Speculators with long exposure towards the sector almost disappeared and only a small change in sentiment now could easily bring buyers back. The sector is exposed to the outlook for economic activity but more importantly how the weather will be behave during the coming months. Signs of La Nina related stress on South American crops during December could be an early signal of potential trouble brewing and this should support crops with the tightest fundamentals such as corn and soybeans. Wheat supplies are plentiful, especially after normalised weather in the Former Soviet Union shifted the global market from production deficit to surplus.
On that basis forward wheat prices which trade at a 25 percent premium to corn compared with only 1 percent on with spot looks relatively expensive given the outlook for the two crops and should be watched closely in the months ahead.
Risks of a near term bounce increases as bullish bets are cut
Hedge funds and large investors have cut their long exposure in US commodities to the lowest level since March 2009. This was the time when the markets were slowly beginning to recover following the Lehman crisis. The most recent data shows that futures and options positions were cut by 12 percent to 656,000 contracts, a nominal reduction of 9 billion dollars to 60 billion dollars.
With January fast approaching many investors are very cautious in regards to the performance of commodities during the early stages of 2012. The sharp reduction in speculative involvement however should be very closely watched as any renewed build in long positions could have a significant impact on prices.
Seasonally over the last 10 years the S&P GSCI index has shown a negative January return in 7 out of 10 years followed by a flat performance in February, only to rally sharply in March. Whether history will be repeated remains to be seen but we are cautious about getting too negative on the sector given the current reduced involvement by hedge funds. 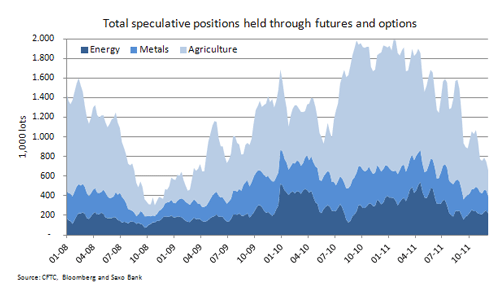
- English (UK)
- English (India)
- English (Canada)
- English (Australia)
- English (South Africa)
- English (Philippines)
- English (Nigeria)
- Deutsch
- Español (España)
- Español (México)
- Français
- Italiano
- Nederlands
- Português (Portugal)
- Polski
- Português (Brasil)
- Русский
- Türkçe
- العربية
- Ελληνικά
- Svenska
- Suomi
- עברית
- 日本語
- 한국어
- 简体中文
- 繁體中文
- Bahasa Indonesia
- Bahasa Melayu
- ไทย
- Tiếng Việt
- हिंदी
Commodities 2011: From Boom to Gloom
Published 12/30/2011, 09:08 AM
Updated 03/19/2019, 04:00 AM
Commodities 2011: From Boom to Gloom
Latest comments
Loading next article…
Install Our App
Risk Disclosure: Trading in financial instruments and/or cryptocurrencies involves high risks including the risk of losing some, or all, of your investment amount, and may not be suitable for all investors. Prices of cryptocurrencies are extremely volatile and may be affected by external factors such as financial, regulatory or political events. Trading on margin increases the financial risks.
Before deciding to trade in financial instrument or cryptocurrencies you should be fully informed of the risks and costs associated with trading the financial markets, carefully consider your investment objectives, level of experience, and risk appetite, and seek professional advice where needed.
Fusion Media would like to remind you that the data contained in this website is not necessarily real-time nor accurate. The data and prices on the website are not necessarily provided by any market or exchange, but may be provided by market makers, and so prices may not be accurate and may differ from the actual price at any given market, meaning prices are indicative and not appropriate for trading purposes. Fusion Media and any provider of the data contained in this website will not accept liability for any loss or damage as a result of your trading, or your reliance on the information contained within this website.
It is prohibited to use, store, reproduce, display, modify, transmit or distribute the data contained in this website without the explicit prior written permission of Fusion Media and/or the data provider. All intellectual property rights are reserved by the providers and/or the exchange providing the data contained in this website.
Fusion Media may be compensated by the advertisers that appear on the website, based on your interaction with the advertisements or advertisers.
© 2007-2024 - Fusion Media Limited. All Rights Reserved.
