On November 1, 2012, Enterprise Products Partners L.P. (EPD) reported results of operations for 3Q 2012. Revenues, operating income, net income and earnings before interest, depreciation & amortization and income tax expenses (EBITDA) for 3Q 2012 and for the trailing 12 months (“TTM”) are summarized in Table 1:
Table 1: Figures in $ Millions, except units outstanding
Fluctuations in revenues and cost of sales amounts are explained in large part by changes in energy commodity prices, especially those for NGLs, natural gas and crude oil. With the exception of crude oil, energy commodity prices during the nine months ended 9/30/12 have been lower when compared to the same period in 2011. Therefore, with one exception, segment revenues were down vs. the prior year periods, as seen in Table 2: 
Table 2: Figures in $ Millions
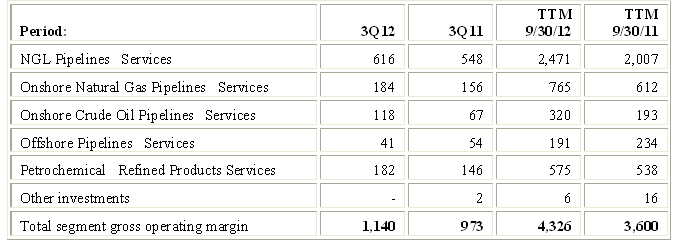
However, lower revenues resulting from decreases in NGL, natural gas, crude oil and petrochemical prices were more than offset by lower costs of sales attributable to these decreases, hence the significant and impressive improvement in gross operating margins, as seen in Table 3 below:
Table 3: Figures in $ Millions
Total segment gross operating margin in Table 3 above is defined by EPD as operating income before: (i) depreciation, amortization and accretion expenses; (ii) non−cash asset impairment charges; (iii) operating lease expenses for which it did not have the payment obligation; (iv) gains and losses from sales of assets and investments; and (v) general and administrative costs.
Given quarterly fluctuations in revenues, working capital needs and other items, it makes sense to review TTM numbers rather than quarterly numbers for the purpose of analyzing changes in reported and sustainable distributable cash flows. In an article titled Distributable Cash Flow (“DCF”) I present the definition of DCF used by EPD and provide a comparison to definitions used by other master limited partnerships (“MLPs”). Using EPD’s definition, DCF for the trailing twelve month (“TTM”) period ending 6/30/12 was $4,770 million ($5.43 per unit), up from $2,615 in the comparable prior year period ($4.37 per unit). As always, I first attempt to assess how these figures compare with what I call sustainable DCF for these periods and whether distributions were funded by additional debt or issuing additional units.
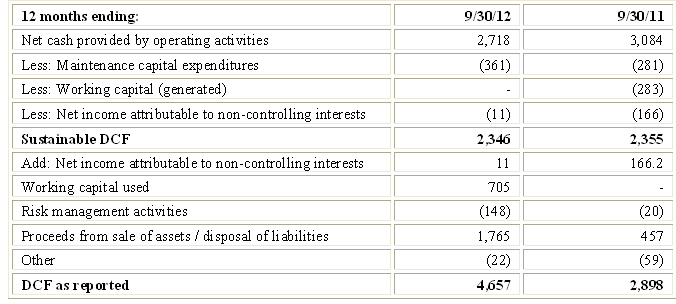
The generic reasons why DCF as reported by the MLP may differ from what I call sustainable DCF are reviewed in an article titled Estimating Sustainable DCF-Why and How. Applying the method described there to EPD results through 6/30/12 generates the comparison outlined in Table 4 below: 
Table 4: Figures in $ Millions
The principal differences between reported DCF and sustainable DCF relate working capital, risk management activities and proceeds from asset sales.
Management adds back cash consumed by working capital in calculating its reported DCF numbers. For the TTM ending 9/30/12, this amounted to $705 million, an unusually high number the bulk of which relates to timing of receipts and payments in 3Q12. It may therefore be reversed in 4Q12. In any event, I generally do not add back working capital used, but do deduct working capital generated, from net cash from operations in deriving sustainable DCF. Despite appearing to be inconsistent, this makes sense because in order to meet my definition of sustainability the MLP should generate enough capital to cover normal working capital needs. On the other hand, cash generated by the MLP through the liquidation or reduction of working capital is not a sustainable source and I therefore ignore it. Over reasonably lengthy measurement periods, working capital generated tends to be offset by needs to invest in working capital. I therefore do not add working capital used to net cash provided by operating activities in deriving sustainable DCF.
In deriving its reported DCF, EPD adds back losses from risk management activities. This item totals $148 million in the TTM ending 9/30/12 and relates to interest rate hedging activities. EPD adds back these losses in calculating DCF while I do not.
Finally, in deriving its reported DCF, EPD adds back proceeds from asset sales. In the TTM ending 9/30/12 these totaled $1,765 million, the largest component of which is the sale of 36 million Energy Transfer Partners, LP (ETE) units for $1,351 million. As readers of my prior articles are aware, I do not include proceeds from asset sales in my calculation of sustainable DCF.
As I calculate it, sustainable DCF for the TTM ending 9/30/12 is roughly at the same level as the prior year period.
Based on my calculations, the DCF per unit numbers and coverage ratios are as indicated in Table 5 below:
If the large outflow related to working capital reverses itself in the current quarter, $3.35 (rather than $2.64) would be a more reasonable approximation of sustainable DCF per unit and coverage based on sustainable DCF would jump to 1.38.
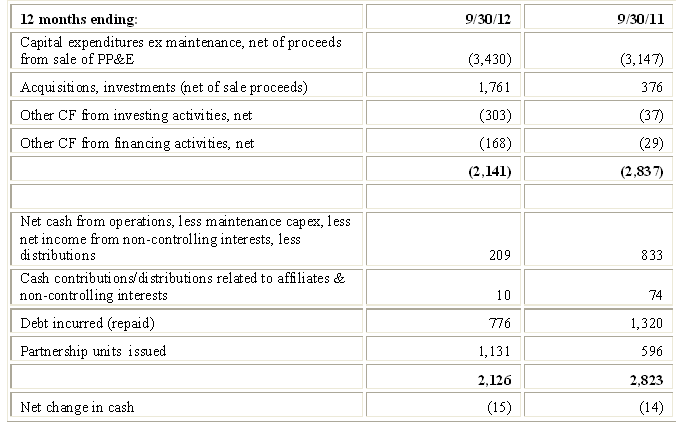
I find it helpful to look at a simplified cash flow statement by netting certain items (e.g., acquisitions against dispositions) and by separating cash generation from cash consumption. Here is what I see for EPD:
Simplified Sources and Uses of Funds
Table 6: Figures in $ Millions
Net cash from operations, less maintenance capital expenditures, less cash related to net income attributable to non-controlling interests exceeded distributions by $209 million in the TTM ending 9/30/12 and by $833 million in the comparable prior year period. EPD is not using cash raised from issuance of debt and equity to fund distributions. The excess enables EPD to reduce reliance on the issuance of additional partnership units or debt to fund expansion projects.
While EPD did state earlier this year that it does not expect to be issuing equity in 2012, I nevertheless said in a prior article that I expect to see additional units issued by the end of 2012 in light of the increase in capital expenditure in 2012 and what’s coming up in 2013. I noted that even if EPD were to issue 15 million units, it would amount to only a 1.7% dilution to existing holders. In September 2012, EOD issued 10.4 million units at $53.07 per unit, which generated total net cash proceeds of $473.3 million. Of course, I was pleased that the number of units issued was lower. \
Overall, EPD has ~$8 billion of growth projects under construction that are scheduled to begin service in the second half of 2012 through 2015. These investments in new natural gas, natural gas liquids (“NGLs”) and crude oil infrastructure are being made to support development of shale plays (Haynesville / Bossier, Eagle Ford, Rockies, Permian Basin/Avalon Shale/Bone Spring, Marcellus/Utica) in anticipation of growing demand for NGLs vs. crude oil derivatives by the U.S. petrochemical industry and by international markets.
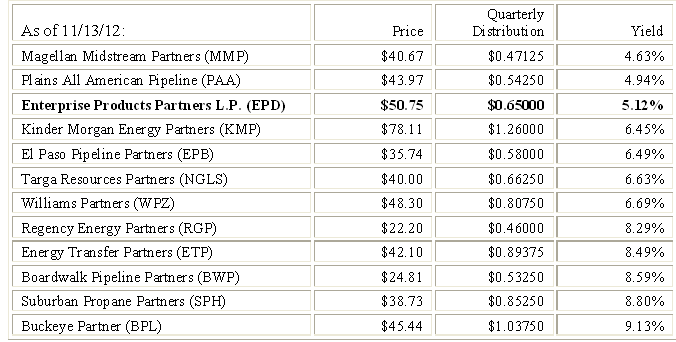
EPD recently announced its 33rd consecutive quarterly cash distribution increase to $0.65 per unit ($2.60 per annum), a 6% increase over the distribution declared with respect to the second quarter of 2011. EPD’s current yield is at the high end of the MLPs I follow: 
I think the premium is justified on a risk-reward basis given EPD’s size, breadth of operations, strong management team, portfolio of growth projects, structure (no general partner incentive distributions), excess cash from operations, history of minimizing limited partner dilution and performance track record. In my view, the recent price drop presents a buying opportunity.
- English (UK)
- English (India)
- English (Canada)
- English (Australia)
- English (South Africa)
- English (Philippines)
- English (Nigeria)
- Deutsch
- Español (España)
- Español (México)
- Français
- Italiano
- Nederlands
- Português (Portugal)
- Polski
- Português (Brasil)
- Русский
- Türkçe
- العربية
- Ελληνικά
- Svenska
- Suomi
- עברית
- 日本語
- 한국어
- 简体中文
- 繁體中文
- Bahasa Indonesia
- Bahasa Melayu
- ไทย
- Tiếng Việt
- हिंदी
Closer Look At Enterprise Products Partners' Distributable Cash Flow
Published 11/15/2012, 01:51 AM
Closer Look At Enterprise Products Partners' Distributable Cash Flow
3rd party Ad. Not an offer or recommendation by Investing.com. See disclosure here or
remove ads
.
Latest comments
Install Our App
Risk Disclosure: Trading in financial instruments and/or cryptocurrencies involves high risks including the risk of losing some, or all, of your investment amount, and may not be suitable for all investors. Prices of cryptocurrencies are extremely volatile and may be affected by external factors such as financial, regulatory or political events. Trading on margin increases the financial risks.
Before deciding to trade in financial instrument or cryptocurrencies you should be fully informed of the risks and costs associated with trading the financial markets, carefully consider your investment objectives, level of experience, and risk appetite, and seek professional advice where needed.
Fusion Media would like to remind you that the data contained in this website is not necessarily real-time nor accurate. The data and prices on the website are not necessarily provided by any market or exchange, but may be provided by market makers, and so prices may not be accurate and may differ from the actual price at any given market, meaning prices are indicative and not appropriate for trading purposes. Fusion Media and any provider of the data contained in this website will not accept liability for any loss or damage as a result of your trading, or your reliance on the information contained within this website.
It is prohibited to use, store, reproduce, display, modify, transmit or distribute the data contained in this website without the explicit prior written permission of Fusion Media and/or the data provider. All intellectual property rights are reserved by the providers and/or the exchange providing the data contained in this website.
Fusion Media may be compensated by the advertisers that appear on the website, based on your interaction with the advertisements or advertisers.
© 2007-2024 - Fusion Media Limited. All Rights Reserved.
