
Cintas Corporation (NASDAQ:CTAS) delivered better-than-expected results for the second quarter of fiscal 2020 (ended Nov 30, 2019). It recorded an earnings beat of 11.27% and sales beat of 1.19% in the quarter under review.
The company’s adjusted earnings in the reported quarter were $2.27 per share, surpassing the Zacks Consensus Estimate of $2.04. On a year-over-year basis, the bottom line increased 29% from the year-ago figure of $1.76 on healthy segmental business and margin improvement.
Segmental Sales
In the quarter under review, Cintas’ net sales were $1,843.7 million, reflecting growth of 7.3% from the year-ago quarter. The improvement was driven primarily by organic sales growth of 7.3%.
Further, the top line marginally surpassed the Zacks Consensus Estimate of $1,822 million.
The company has two reportable segments — Uniform Rental and Facility Services, and First Aid and Safety Services. Other businesses like Uniform Direct Sale and Fire Protection Services are included in All Other. Quarterly sales data is briefly discussed below.
Revenues from the Uniform Rental and Facility Services segment (representing 79.7% of the reported quarter’s net sales) were $1,470 million, increasing 5.7% year over year. Organic sales were recorded at 5.8%.
Revenues from the First Aid and Safety Services segment (representing 9.2% of the reported quarter’s net sales) totaled $169.7 million, increasing 10.6% year over year. Organic sales in the quarter increased 10.6%.
Revenues from the All Other business (representing 11.1% of the reported quarter’s net sales) were $204.1 million, increasing 17.2% year over year.
Gross Margin
In the quarter under review, Cintas’ cost of sales (comprising costs related to uniform rental and facility services as well as others) increased 5.1% year over year to $991.4 million. It represented 53.8% of net sales compared with 54.9% in the year-ago quarter. Gross profit in the quarter increased 10% year over year and gross margin was up 110 basis points (bps) to 46.2%.
Selling and administrative expenses totaled $517.9 million, reflecting a 5.3% increase over the year-ago figure. It represented 28.1% of net sales. Operating margin in the quarter expanded 210 bps year over year to 18.1%.
Balance Sheet and Cash Flow
Exiting the quarter, Cintas’ cash and cash equivalents were $226.5 million, up 121.8% from $102.1 million at the end of the previous quarter. Long-term debt remained more or less unchanged, sequentially, at $2,538.6 million.
In the first half of fiscal 2020, the company generated net cash of $571.4 million from operating activities, increasing 65.8% from the year-ago figure. Capital expenditure totaled $126.2 million, reflecting a year-over-year decline of 8.3%. Free cash flow surged 115.1% year over year to $445.2 million.
During the first half of fiscal 2020, the company repurchased shares worth $258.7 million.
Outlook
For fiscal 2020 (ending May 2020), Cintas raised the revenue projection to $7.29-$7.33 billion from the previously stated $$7.28-$7.32 billion. The revised guidance suggests growth of 5.8-6.4% from the year-ago reported figure.
Earnings are predicted to be $8.65-$8.75 per share versus $8.47-$8.57 stated earlier. This indicates year-over-year growth of 13.8-15.1%.
Cintas Corporation Price and Consensus
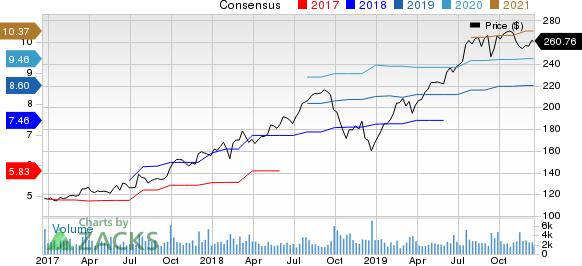
Cintas Corporation price-consensus-chart | Cintas Corporation Quote
Zacks Rank & Stocks to Consider
With a market capitalization of approximately $27 billion, Cintas currently carries a Zacks Rank #3 (Hold).
Some better-ranked stocks in the Zacks Industrial Products sector are Tennant Company (NYSE:TNC) , DXP Enterprises, Inc (NASDAQ:DXPE) and Standex International Corporation (NYSE:SXI) . While Tennant currently sports a Zacks Rank #1 (Strong Buy), DXP Enterprises and Standex carry a Zacks Rank #2 (Buy). You can see the complete list of today’s Zacks #1 Rank stocks here.
In the past 60 days, earnings estimates for Tennant and DXP Enterprises have improved for the current year, while the same has been unchanged for Standex. Further, positive earnings surprise for the last reported quarter was 40% for Tennant, 16.39% for DXP Enterprises and 2.11% for Standex.
7 Best Stocks for the Next 30 Days
Just released: Experts distill 7 elite stocks from the current list of 220 Zacks Rank #1 Strong Buys. They deem these tickers “Most Likely for Early Price Pops.”
Since 1988, the full list has beaten the market more than 2X over with an average gain of +24.6% per year. So be sure to give these hand-picked 7 your immediate attention.
See 7 handpicked stocks now >>
Cintas Corporation (CTAS): Free Stock Analysis Report
Standex International Corporation (SXI): Free Stock Analysis Report
DXP Enterprises, Inc. (DXPE): Free Stock Analysis Report
Tennant Company (TNC): Free Stock Analysis Report
Original post