
U.S. energy giant Chevron Corp. (NYSE:CVX) reported strong second-quarter results amid the recovery in commodity prices, production gains and the success of its cost savings initiatives. The company reported earnings per share (excluding special items) of 91 cents, higher than the Zacks Consensus Estimate of 89 cents and the year-ago profit of 48 cents.
Quarterly revenue of $34,480 million surpassed the Zacks Consensus Estimate of $31,182 million and were up 18% year over year.
Chevron becomes the third integrated supermajor after Royal Dutch Shell (LON:RDSa) plc RDS.A, ExxonMobil Corp. (NYSE:XOM) in reporting first quarter numbers. London-based BP plc (NYSE:BP) is scheduled to report during the next week.
Chevron Corporation Price, Consensus and EPS Surprise
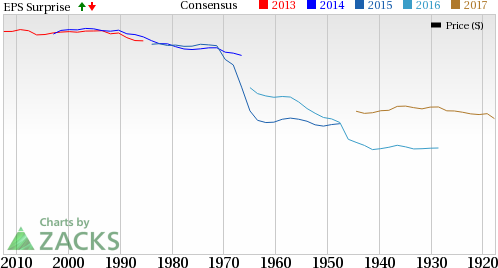
Chevron Corporation Price, Consensus and EPS Surprise | Chevron Corporation Quote
Segment Performance
Upstream: Chevron’s total production of crude oil and natural gas increased 10% compared with last year’s corresponding period to 2,780 thousand oil-equivalent barrels per day (MBOE/d). The U.S. output increased 3% year over year to 701 MBOE/d, while the company’s international operations (accounting for 75% of the total) was up 13% to 2,079 MBOE/d.
The rise in output could be attributed to contributions from major capital projects, core business, shale assets, as well as and lower downtime associated with maintenance activities. These were partly offset by normal field declines, production entitlement effects in different regions and the result of property divestitures.
The rise in production was supported by higher realizations, the result being a massive turnaround in Chevron’s upstream segment – from a loss of $2,462 million in the year-earlier quarter to a profit of $853 million.
Downstream: Chevron’s downstream segment achieved earnings of $1,195 million, 6% less than the profit of $1,278 million last year. The fall primarily underlined the absence of net gains from asset sales.
Cash Flows
Importantly, Chevron delivered a good cash flow performance this quarter – an important gauge for the oil and gas industry – with $5,036 million in cash flow from operations, up from $2,531 million a year ago.
Costs & Expenses
Exploration costs fell from $214 million in the second quarter of 2016 to $125 million. The second-largest U.S. oil company by market value after ExxonMobil spent $4,538 million in capital expenditures during the quarter, a considerable decline from the $5,523 million incurred a year ago. Roughly 89% of the total outlays pertained to upstream projects.
Balance Sheet
As of Jun 30, 2017, the San Ramon, CA-based Zacks Rank #4 (Sell) company had $4,762 million in cash and total debt of $42,864 million, with a debt-to-total capitalization ratio of about 22.7%. You can see the complete list of today’s Zacks #1 Rank (Strong Buy) stocks here.
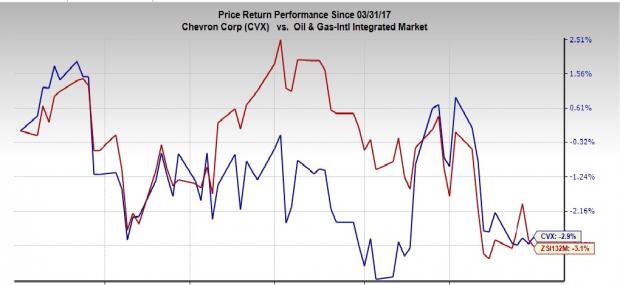
Share Performance: Shares of Chevron have lost 2.8% during the second quarter versus the 3.1% decline of the industry.
The Hottest Tech Mega-Trend of All
Last year, it generated $8 billion in global revenues. By 2020, it's predicted to blast through the roof to $47 billion. Famed investor Mark Cuban says it will produce "the world's first trillionaires," but that should still leave plenty of money for regular investors who make the right trades early. See Zacks' 3 Best Stocks to Play This Trend >>
BP p.l.c. (BP): Free Stock Analysis Report
Chevron Corporation (CVX): Free Stock Analysis Report
Royal Dutch Shell PLC (RDS.A): Free Stock Analysis Report
Exxon Mobil Corporation (XOM): Free Stock Analysis Report
Original post
Zacks Investment Research