Get 40% Off
💰 Warren Buffett reveals a $6.72 billion stake in ChubbCopy Portfolios

Chart Review: SPY, QQQ, DIA

Published 03/28/2013, 06:44 AM
Updated 07/09/2023, 06:31 AM
DJI
-
BIG
-
DIDA
-
SPY: SPY

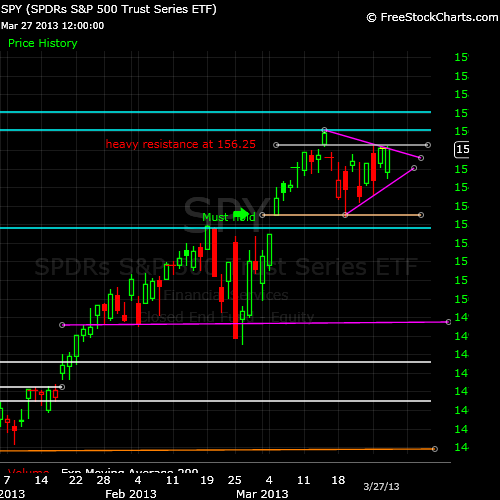
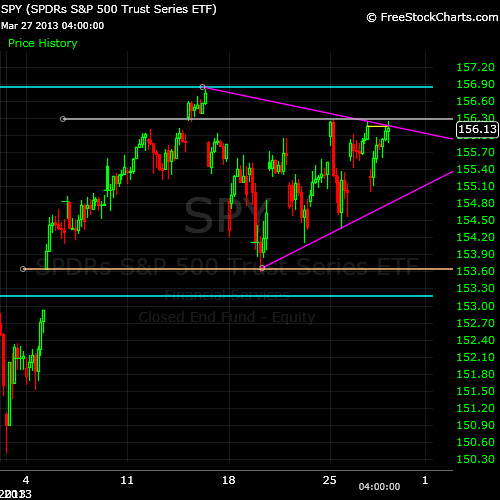
continues to stay in its triangle and range once again failing to break above 156.25 and the downtrend of the triangle pattern. Intra-day and short-term SPY is finding support between 155.20 and 155.00. If this level breaks it could be an early warning sign for more bearishness. But really the important level to watch is 156.25, the last three days this level has stopped the market cold in its tracks and what is has done is formed an intra-day ascending triangle pattern with the top of this pattern at 156.25. A break above this level and SPY can go higher with a measured move to 158sh. This would fit with the 7 day up and 2% down historical trend. Of course if SPY breaks below the 155 level this is off and it is a breakdown of the triangle pattern.

  • Key Levels to Watch:
  • Resistance: 156.65, 154.67
  • Support: 154.35, 154.20, 152.90
SPDRs S&P 500 ETF
SPY Hourly
QQQ:

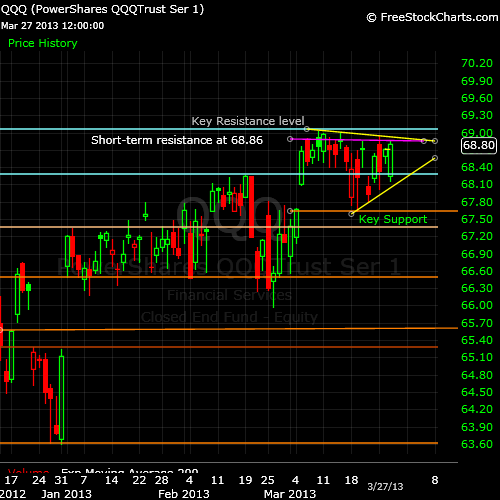
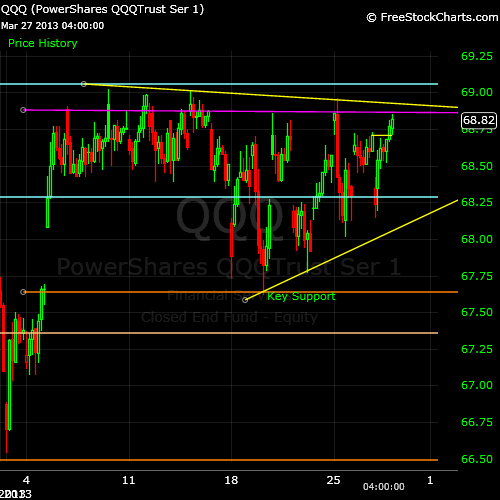
The Q’s (QQQ) were the bullish of all the indexes closing slightly green. They bounced off its lows 68.52 and near the lows from yesterday and reaching the highs at 68.86 only to fail at those levels as the resistance from 68.86-69.02 remains a tough level to break. The Q’s remain in the tight range and triangle with short-term support at 68.23 and strong resistance at 68.86 and it will remain this way till one breaks. A warning sign to any possible move lower is a break of very short-term support at 68.70.

  • Key Levels:
  • Resistance: 68.96-69.02
  • Support: 68.00, 67.69
PowerShares QQQ Trust
QQQ Hourly
DIA:

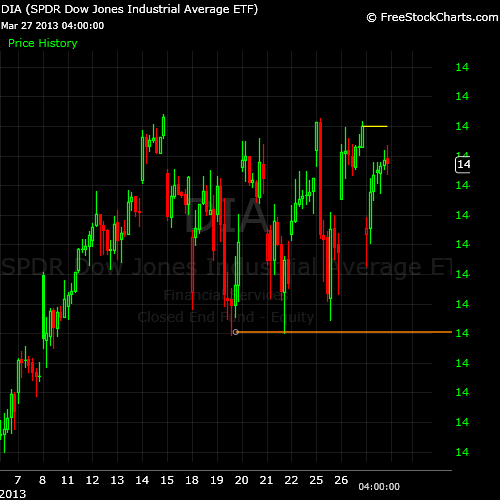
The Dow (DIA) was the weaker of the indexes close red for the day and failing to get close to its high from yesterday today’s high was at 145.09.DIA won’t get bullish till it gets over the 145.55 level or the all-time high. The hourly chart the Dow looks weaker than the others as well as it looks like it is forming a rounded top and looking to roll over. The hourly also has a clear short-term downtrend that has started since yesterday’s high. A big warning for more downside comes with a break of 144.74. With the Piker Indicator being bearish and this chart looking bearish, be careful with any new longs.
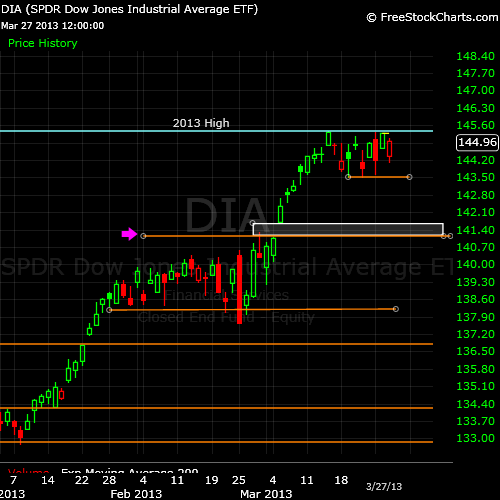
SPDR Dow Jones Industrial Average ETF
DIA Hourly

  • Key Levels:
  • Resistance: 145.35
  • Support: 143.38
3rd party Ad. Not an offer or recommendation by Investing.com. See disclosure here or remove ads .

Latest comments

Risk Disclosure: Trading in financial instruments and/or cryptocurrencies involves high risks including the risk of losing some, or all, of your investment amount, and may not be suitable for all investors. Prices of cryptocurrencies are extremely volatile and may be affected by external factors such as financial, regulatory or political events. Trading on margin increases the financial risks.
Before deciding to trade in financial instrument or cryptocurrencies you should be fully informed of the risks and costs associated with trading the financial markets, carefully consider your investment objectives, level of experience, and risk appetite, and seek professional advice where needed.
Fusion Media would like to remind you that the data contained in this website is not necessarily real-time nor accurate. The data and prices on the website are not necessarily provided by any market or exchange, but may be provided by market makers, and so prices may not be accurate and may differ from the actual price at any given market, meaning prices are indicative and not appropriate for trading purposes. Fusion Media and any provider of the data contained in this website will not accept liability for any loss or damage as a result of your trading, or your reliance on the information contained within this website.
It is prohibited to use, store, reproduce, display, modify, transmit or distribute the data contained in this website without the explicit prior written permission of Fusion Media and/or the data provider. All intellectual property rights are reserved by the providers and/or the exchange providing the data contained in this website.
Fusion Media may be compensated by the advertisers that appear on the website, based on your interaction with the advertisements or advertisers.
© 2007-2024 - Fusion Media Limited. All Rights Reserved.