by Pinchas Cohen
Growing Gap Between Reality And Expectations
“I like dirt and rocks and facts,” says Kevin Spacey’s 'House of Cards' character Frank Underwood, interrupting an excited group of billionaires discussing a futuristic technology that would preserve someone’s memory and even personality in a data storage center in the desert. This is from Netflix’s (NASDAQ:NFLX) blockbuster series 'House of Cards,' Season 5 episode 8, which aired on May 30.
The show presented the argument between the tangible, here-and-now and an incorporeal, futuristic technology.
The show’s timing was appropriate on three levels:
- It aired eight days before the first technology-heavy NASDAQ selloff, that occurred as a result of a Goldman Sachs report that investors were overconfident in the value of big tech companies relative to what those companies palpably deliver in the form of revenue and earnings, which is reminiscent of the 2000 dotcom crash.
- It aired 11 days before the Fed's rate increase and reflationary outlook, which spurred a leadership rotation in the stock market, out of tech and into financials.
- It aired a month-and-a-half before Netflix put the NASDAQ on pace for its longest winning streak in 2-years, which registered a record high and close, blowing past its June 9 selloff, which was spurred by the very same Goldman Sachs report that claimed that big tech was over-valuated.
The House of Cards scene depicted a group of billionaires excited over futuristic technology. That same excitement has boosted the NASDAQ to overly high valuations. Case in point, tech is rallying both on good earnings reports and the expectation of good earnings, which has rolled back the tech-to-financials rotation; financials have slumped, while tech has taken off.
While financials and tech are the two sectors expected to show strong earnings this quarter (while propping up their respective indexes), the market has been ratcheting expectations higher on tech, to one of the widest gaps in years between forward and trailing earnings, while lowering expectations for financials.

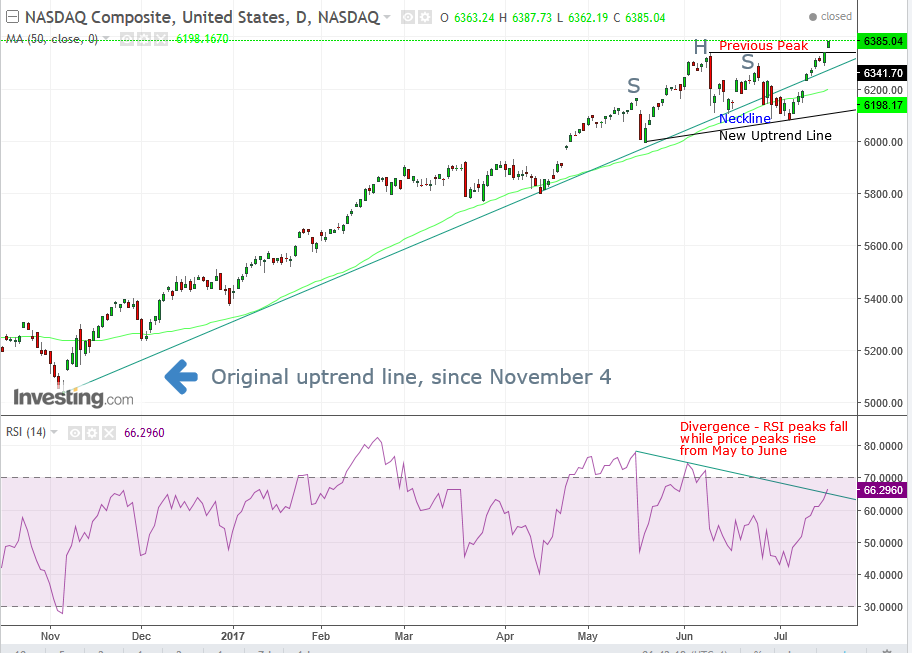
We have previously reported that the NASDAQ 100 had completed a H&S, in which the May 18 and June 12 lows formed the neckline, while the NADSAQ Composite hit lows on the 18th and 15th. On June 29, the pattern was completed with a decisive close beneath the neckline. However, the ensuing rally crossed above the neckline, suggesting the pattern failed and would turn into a continuing consolidation pattern.
While the NASDAQ 100 tech didn’t overcome its pre-June 9 selloff, the Composite did so on Monday, and extended its gains yesterday on a rising gap, as the RSI peaked above its downtrend line, whose divergence suggested the price will follow downward.
The fact that the NASDAQ tech didn’t yet overcome its prior peak throws a wrench into the narrative that the rotation out of tech is over.
The Composite’s up-gap yesterday may turn out to be an island-reversal. Even so, the downside implication is that of a correction, rather than a reversal.
Going back to Frank Underwood’s “…dirt and rocks and facts,” the index blew past its 6341.40 June 9 selloff high, forming an uptrend and returning to the existing uptrend, which was interrupted when the price fell below it, between June 29 and July 12, with two series of higher peaks and troughs.
The May 18 first neckline low and the pattern completion on the low of July 6 have turned into the two rising troughs, and the pre-June 6 selloff and yesterday’s higher high plotted the two rising peaks.
Target Implications
The failed H&S turns into a continuing consolidation pattern with an upward implication of at least 300 points, or 4.5 percent.
Trading Strategies
Conservative traders may wait on a long to see if yesterday’s up-gap proves to be an island reversal, with a down-gap today. They also may wait for a dip within a correction, as the index has been advancing for 9 straight days. The correction may dip as low as the new uptrend line, at around 6130.00 per today’s angle, and rising. Perhaps it would meet with the 50 dma (green), currently at 6198.00.
Moderate traders may wait on a long for a correction to the original uptrend line since November 4, 2016, which at today’s angle, is at 6275.00 and rising.
Aggressive traders may go long now, with a stop-loss beneath the double support of the June 9 6340.70 peak high and the 6344.55 bottom of yesterday’s gap.
Very Aggressive traders may short on the hope of filling the gap (while understanding that the idea that gaps must be filled is a myth), whether an island reversal or not, with a short stop-loss above yesterday’s 6387.73 high, with a target per the above described supports. This should be done while keeping an eye out for any bullish consolidations – exiting and turning around on a long, per the above described target.
