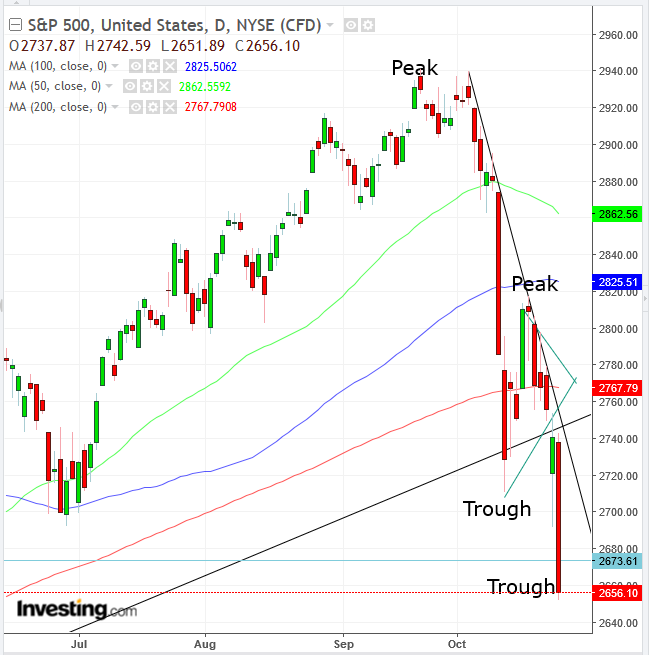
The S&P 500 Index—despite dropping 3.09 percent yesterday to extend its losses so far in October to 8.8 percent—remains in a long-term uptrend. This uptrend will continue as long as the index stays above the 2,500 level, the previous trough in the long-term trend, achieved back in February.

In the mid-term, however, the benchmark entered a downtrend, after already falling below the mid-term uptrend line, since the previous correction on February 2016, as well as the 200 DMA, yesterday's decline registered a trough, lower than the last low of 2710.51 on October 11.
That means that over the next few weeks, declines are more likely than advances. In other words, shorting the S&P 500 in the direction of its presumed impetus is a strategy that will reap better gains than buying into dips. This is the likely trajectory until the index reaches the 2,500 level or bottoms out.
The consolidation from October 11–22 in the form of a pennant is considered a continuation pattern, and therefore bearish after the drop from the record high of 2,940. It is also expected to replicate the move that preceded it, in this case more than 200 points.
Therefore, the target would be 200 points below the 2,750 breakout level, to 2,550, which just happens to be above the 2,532 trough of February 18, fitting into the technical picture. Note that continuation patterns such as this typically include a return-move as the market retests the trend, before reaching the presumed objective.
Trading Strategies
Conservative traders should wait for the mid-term to realign with the long-term trend.
Moderate traders would short upon a return-move to the 2,760 area and wait for confirmation of pattern integrity, with at least one long red candle, following a green or small candle of any color.
Trade Sample:
- Entry: 2,750
- Stop-loss: 2,780
- Risk: 30 points
- Target: 2,600, above the full objective, to beat other traders exiting the short.
- Reward: 150 points
- Risk-Reward Ratio: 1:3
Aggressive traders may short after a bounce, with a stop-loss, providing they accept the higher potential to be stopped out. A stop-loss above the resistance of the pattern would render an unattractive risk-reward ratio relative to the expected follow-up fall, up to the February support.
Trade Sample:
- Entry: 2,700
- Stop-loss: 2,720
- Risk: 20 points
- Target: 2,560
- Reward: 100 points
- Risk-Reward Ratio: 1:5
