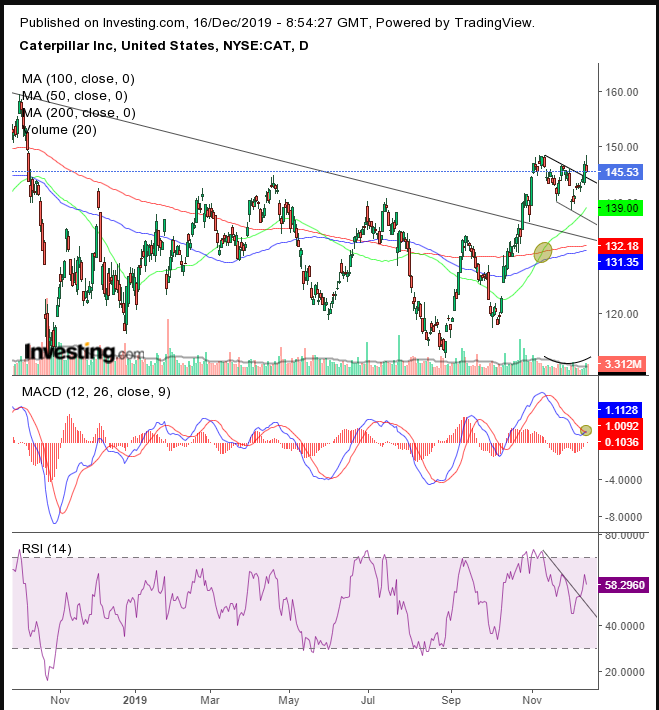
Caterpillar's (NYSE:CAT) 1.9% jump on Thursday, as word of an upcoming preliminary deal began to make the rounds, suggests there is more where that came from.
The announcement on Friday of the long-awaited Phase 1 trade agreement between China and the U.S., the world’s two largest economies, boosted CNBC’s China Trade Index, which tracks the 25 firms traded in the U.S. with the biggest China revenue exposure. The Index—which includes such mega cap companies as Baidu (NASDAQ:BIDU), Alibaba (NYSE:BABA), Walmart (NYSE:WMT), Apple (NASDAQ:AAPL) and Nike (NYSE:NKE)—leaped by almost 2.5%.
We reviewed each of the technical charts of these firms to pick the company that, in our estimation, shows the most promise should a trade resolution actually be finalized.
Though Baidu provided the most upside potential from a technical perspective, it may not yet have bottomed. Caterpillar, on the other hand, showed the most evidence of an upside reversal. Add to that the company’s generous dividend package, a quarterly dividend of $1.03 with a current yield of 2.8%, and the Deerfield, IL-based heavy machinery manufacturer offers a rosy outlook—barring, of course, any further, nasty trade surprises.

Thursday’s narrative of a U.S.-Sino trade deal imbued investors with renewed vigor, taking most stocks to all-time highs. Caterpillar shares advanced beyond a range within which it has been trapped for a month, as it trades at the highest point for the stock since October 2018.
It has fallen as much as 60% since January 2018. On Aug. 28, the stock bottomed, then gained almost 33% up to its early November highs. Since then, however, it has returned to a decline, with one important caveat. It had already breached the long-term downtrend line since January 2018.
The trade announcement on Dec. 12 pushed the stock through the upside of the ceiling of its month-long range. Textbook wisdom dictates that flags range from one to three weeks. But this pattern lasted a month. However, we feel comfortable with our assessment, considering its dynamics are the same as the continuation pattern.
Volume has been drying up throughout the range trading but increased on the breakout. The pattern developed on top of the broken, long-term downtrend line, a good time for early traders to take profit, passing the load onto newcomers.
The 50 DMA crossed above the 200 DMA, triggering a golden cross to kickstart the bullish pattern. The RSI crossed above its downtrend line before the price did, triggering a positive divergence and giving observant technicians a heads up. Even the lagging MACD’s shorter MA crossed above its longer MA, signaling a further rise.
Putting all these indicators into one coherent picture suggests all the conditions of a bullish flag: the stock took a breather after adding one third to its value, which included important technical milestones. At the same time, other traders picked up where sellers left off. This was demonstrated by the upside breakout, as demand absorbed all available supply, suggesting it's ready to repeat the October-November move.
Trading Strategies – Long Position Setup
Conservative traders should wait for the price to scale above the flag’s high point and break through the $150 psychological level to create a base there, before committing to a position.
Moderate traders may enter a long position upon a return move from above $150 for a better entry, not necessarily for proof of support.
Aggressive traders may risk a long position, provided they follow a prepared plan that fits their account’s needs.
Trade Sample
