European stocks are outperforming today. The improved chances of US stimulus have increased optimism that the recently stalling economic recovery is about to get another boost.
Since they hold the purse strings, banks are seen as perhaps the biggest beneficiaries of economic recoveries. That’s why, Friday’s apparent progress between Democrats and Republicans on a deal both parties could agree on, managed to reverse Bank of America's (NYSE:BAC) plunge of 2% during the day, flipping it to a 0.5% gain at the close. That's in comparison to the broader market which turned higher on the news, but still closed in the red.
All that positive volatility may have given traders a rush ahead of the weekend, but we don't see BAC shares pushing higher from here. In fact, we think they could be about to lose significant value. Even if the illusive stimulus deal does finally come to fruition, a reliable economic recovery isn't a forgone conclusion. And just as banks are among the first to enjoy true economic growth, they’re at the forefront of institutions that suffer when there's a setback.
Plus, there's another headwind looming, irrespective of the speed or sluggishness of economic growth...near-zero interest rates diminish bank margins, and that's their bread-and-butter.
But it’s the supply-demand picture on the technical chart that may be the most definitive 'tell' regarding where BofA shares are headed next.

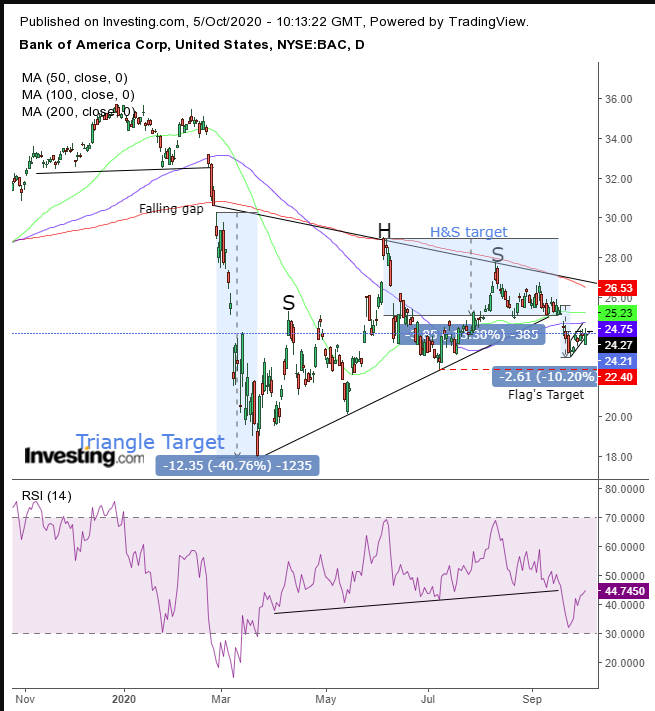
Friday’s rebound saved the stock from completing a rising flag, bearish after a 10% downward drop in just the five session that precede the pattern. This is called a “flagpole.” Still, the price confirmed a nearly two-week resistance.
But note the location of the flag. It developed when the price tested the July lows. If the flag completes, providing a downside breakout, it will have the momentum to post a lower trough, forming a short-term downtrend. And if that scenario plays out, we’d have the setup for an even bigger move—a symmetrical triangle.
At first, we considered the range since the February top an upward-sloping H&S continuation pattern. However, after more deeply considering the 200 DMA and its movement along the various technical pressure points on the chart, we're now inclined to think we've got a symmetrical triangle on our hands.
And indeed, we can’t help but step back and admire the symmetry of the supply-demand balance. The 200 DMA faithfully traces the top of a symmetrical triangle, which starts immediately after the completion of a top. This is a range in which contracts change hands between buyers and sellers (who might even be the same players, switching sides along with the shifting narratives), marking the falling gap on Feb. 27 that occurred when COVID fears turned everyone into sellers.
The difference between an upsloping H&S pattern and a symmetrical triangle is not academic. Rather, it has real consequences for the following moves. Traders therefore measure them differently to establish a target.
While the H&S is measured between its highest and breakout points, the symmetrical triangle is measured between its highest and lowest points.
Since the H&S is upward-sloping, the slope chipped into the implied target. Measuring the pattern’s head and breakout point gives us a $3.85 implied move, much of which was already been achieved upon the breakout.
However, if the tug of war between bulls and bears within the pattern (including those who played both sides) was a buildup that follows a symmetrical triangle breakout, the implied target is a much more significant $12.35 implied move.
It’s important to understand that these are merely gauges that measure momentum, not lottery numbers sent from the future.
The RSI is currently retesting a top in momentum, reflecting the rising flag, testing the larger pattern.
Trading Strategies
Conservative traders will wait for the flag’s downside breakout to post a lower trough than the $22.40 posted on July 9 before shorting.
Moderate traders are likely to short the flag’s downside breakout immediately.
Aggressive traders may short now, anticipating the downside breakout, following the larger pattern’s downside breakout, as long as they accept the potential for a return move larger than the current flag, to the larger pattern. Money management is crucial. Here’s an example:
Trade Sample
- Entry: $25
- Stop-Loss: $27
- Risk: $2
- Target: $13 – triangle’s implied target
- Reward: $12
- Risk:Reward Ratio: 1:6
Note: This is just a sample, not holy writ. We cannot tell the future. We're simply weighing the available evidence and attempting to control risk while allowing for the potential of a reward. If you did not read and understand the full analysis, do not make the trade. Your timing, budget and temperament will impact the results of the trade.
Which stock should you buy in your very next trade?
With valuations skyrocketing in 2024, many investors are uneasy putting more money into stocks. Unsure where to invest next? Get access to our proven portfolios and discover high-potential opportunities.
In 2024 alone, ProPicks AI identified 2 stocks that surged over 150%, 4 additional stocks that leaped over 30%, and 3 more that climbed over 25%. That's an impressive track record.
With portfolios tailored for Dow stocks, S&P stocks, Tech stocks, and Mid Cap stocks, you can explore various wealth-building strategies.

