Citigroup (NYSE:C) is schedule to report Q1 '18 earnings this coming Friday, April 13, before market open. The consensus is for an EPS of $1.62, versus $1.36 for the same quarter last year.
It's possible that along with any top and bottom line issues, Citigroup may also be about to experience some strong political headwinds. The recent decision by the fourth largest bank in the US to require its retail clients to limit firearm sales, in the wake of the Parkland, FL high school shootings, has rubbed Republican lawmakers the wrong way. In particular, some GOP members of the Senate Banking Committee, whose constituents are extremely protective of gun rights, believe the financial institution should have been more mindful of both the recent Republican backed bank deregulation, and the fact that it was the government that bailed them out during the 2008 market meltdown. As such these politicians believe Citi should not be dictating policy in this arena.
Republicans are now scrutinizing Citigroup's government contracts and threatening not to be there the next time the bank needs Congressional assistance.

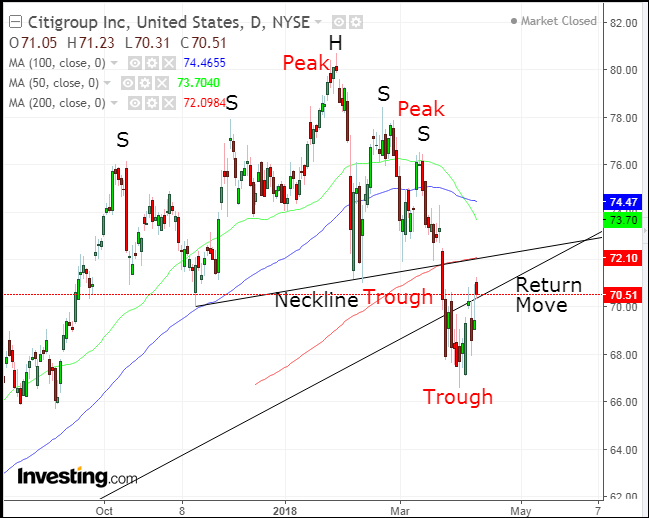
Citigroup's technical picture isn't promising either. The price action formed a complex H&S. It was completed with a downside breakout on March 22nd. The breakout's validity was confirmed with a 7 percent penetration, filtering out a bear trap. At the same time, the price fell 4.5 percent below the uptrend line since the February bottom, as well as the 200 dma (red), which made a lot of noise in trader circles when the S&P 500 fell below its own 200 dma.
Unlike the benchmark index though, it did not climb immediately above it. In fact, even after a 6 percent rebound, it is still 2 additional percent below the 200 dma.
As well, unlike the S&P 500, which never breached its February lows and is still maintaining an uptrend, the latest Citi selloff registered new lows, completing the required descending peak and trough series for a downtrend.
Currently, everything is in place for a reversal from an uptrend into a downtrend:
- Broken uptrend line
- H&S top
- Descending series of peaks and troughs
Additionally, the 50 dma (green) crossed below the 100 dma (blue), another, more recent sign of price data weakening compared to longer term positions. Also, yesterday's price remained below the resistance of the shooting star from the preceding session.
Finally, the 6 percent rebound is considered a return move, a correction with a downtrend, which provides the exceptional opportunity to come in at a better position.
Trading Strategies - Short Position
Conservative traders would wait for a further return move to the neckline, for an entry closer to the resistance, above where the stop loss would be placed.
Moderate traders may wait for the price, which crawled above the uptrend line since the February bottom, which closed below it.
Aggressive traders are likely to short immediately.
Equity Management
Stop-Losses (Above provided parameters):
- 70.51, yesterday's high
- 72.10, 200 MA and the uptrend line since the February bottom
Targets (above provided levels):
- $66.25, the March low and June-September 2017 support
- $63, implied pattern's target, by measuring H&S
There are many trading strategies available for the same instrument at the same time. A trader must establish a plan, which would take into account his resources and temperament. This is crucial and determines success or failure.
Pair entries and exits should provide a minimum 1:3 risk-reward ratio. They should suit your time frame, with the understanding that the further the prices, the longer it will take to achieve them. Finally, understand that these guidelines are probability-based, which means by definition they include losses on individual trades, with the aim of profits on overall trades.
