🔮 Better than the Oracle? Our Fair Value found this +42% bagger 5 months before Buffett bought itRead More

Cern Remains A Buy

Published 05/01/2019, 12:24 AM
Updated 07/09/2023, 06:31 AM
CERN
-

CERN Weekly Chart

It is always dangerous to blindly follow the herd, but the consensus among the analysts is that Cerner Corporation (NASDAQ:CERN) remains a strong buy, and on this occassion, I agree with them, which is unusual. There are several reasons for my opinion.

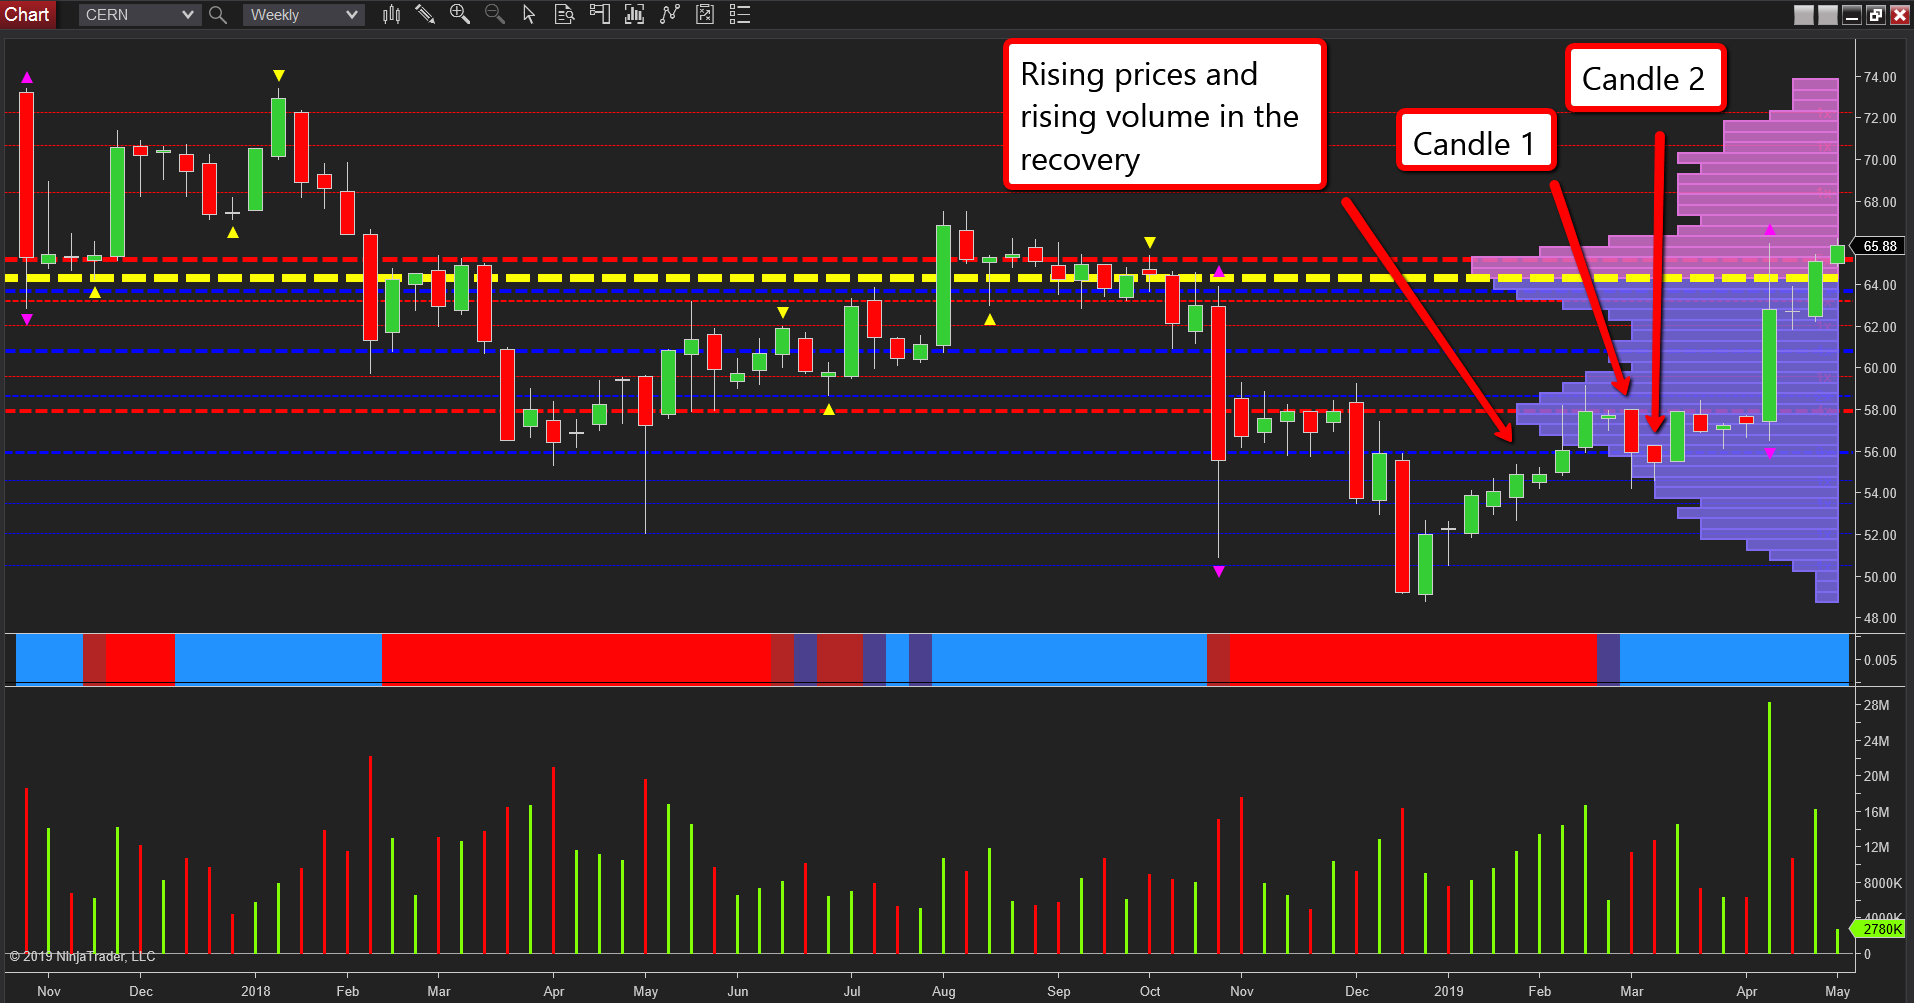
First, the recovery in the stock price from the start of the year has seen some classic volume price analysis relationships at work with Wyckoff’s third law in evidence. Here we see the effort and result in agreement with steadily rising prices supported by steadily rising volume as the price of the stock recovered off the lows of $48.78 to move to test resistance at the $58 price level, denoted with the red dashed line of the accumulation and distribution indicator. As this level was tested, note how the market makers stepped in on candles 1 and 2, buying into the weakness. Notice also how the selling pressure then diminishes, until we see the sharp move higher on extreme volume, which also triggers the volatility indicator. Since then further positive signals have followed, in particular, last week’s price action supported with excellent volume as the stock breached resistance in the $65.50 area as denoted by the red dashed line immediately above the volume point of control in yellow.

So where next for Cern, and here two things are key. First, we need to see the price continue to break away from the volume point of control (VPOC) on rising volume and clear the top of the volatility indicator in the $66 area but expect to see some consolidation first. Once through here the $67.57 level of August last year becomes the next objective, and finally, if this is taken out, a longer-term return to the $74 area. The region from $66 to $74 is also key for another reason, as volumes on the VPOC indicator are falling away the higher we move, thereby presenting less resistance to the advance which is confirmed with the trend monitor below.

Latest comments

Loading next article…
Risk Disclosure: Trading in financial instruments and/or cryptocurrencies involves high risks including the risk of losing some, or all, of your investment amount, and may not be suitable for all investors. Prices of cryptocurrencies are extremely volatile and may be affected by external factors such as financial, regulatory or political events. Trading on margin increases the financial risks.
Before deciding to trade in financial instrument or cryptocurrencies you should be fully informed of the risks and costs associated with trading the financial markets, carefully consider your investment objectives, level of experience, and risk appetite, and seek professional advice where needed.
Fusion Media would like to remind you that the data contained in this website is not necessarily real-time nor accurate. The data and prices on the website are not necessarily provided by any market or exchange, but may be provided by market makers, and so prices may not be accurate and may differ from the actual price at any given market, meaning prices are indicative and not appropriate for trading purposes. Fusion Media and any provider of the data contained in this website will not accept liability for any loss or damage as a result of your trading, or your reliance on the information contained within this website.
It is prohibited to use, store, reproduce, display, modify, transmit or distribute the data contained in this website without the explicit prior written permission of Fusion Media and/or the data provider. All intellectual property rights are reserved by the providers and/or the exchange providing the data contained in this website.
Fusion Media may be compensated by the advertisers that appear on the website, based on your interaction with the advertisements or advertisers.
© 2007-2024 - Fusion Media Limited. All Rights Reserved.