CarMax, Inc. (KMX) is a holding company and its operations are conducted through its subsidiaries. CarMax also wholesale used vehicles. The Company is a retailer of used cars, based on the 408,080 used vehicles it retailed during the fiscal year ended February 29, 2012 (fiscal 2012).
This is a vol, stock and order flow note. The catalyst for the move yesterday is some news, and that is included below:
Shares of Carmax (KMX) soared as much as 11.5% in early trading Monday after a report said the largest used-car dealership chain's revenue will rise 17% this quarter vs. last year.
The report on Carmax, by Theflyonthewall.com citing data from ITG Research, said CarMax is likely to top analysts' consensus estimate when it announces third quarter results in December. -- Source: Investors.com via Yahoo! Finance; Carmax Surges On Report Of Sharp Rise In Q3 Sales, written by James Detar.
So there you go, good news 'n stuff. Let's start with the order flow. The company has traded over 15,000 contracts on total daily average option volume of just 1,320. Calls have traded on a 2.2:1 ratio and I do note that the daily average volume has a 1:1.6 call:put ratio (so more puts than calls). The Stats Tab snapshot is included (below).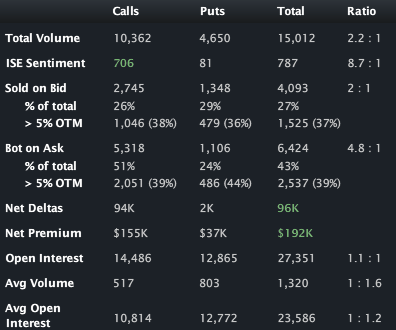
The Options Tab (below) illustrates the action. The heaviest volume in the front two months is in the Oct 32 calls and Nov 33 calls (with some good volume in the Oct 32 puts as well). Note that the volume is greater (substantially so) than the existing OI -- so these feel like opening positions. The Oct 32 and Nov 33 calls all look like purchases to me -- just offers lifted without even an attempt to bid up and get better prices. In English, call buyers...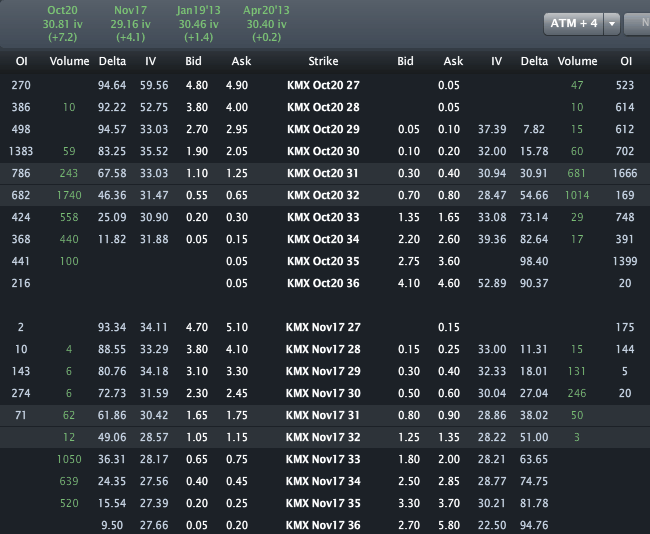
The Skew Tab snap (below) illustrates the vols by strike by month.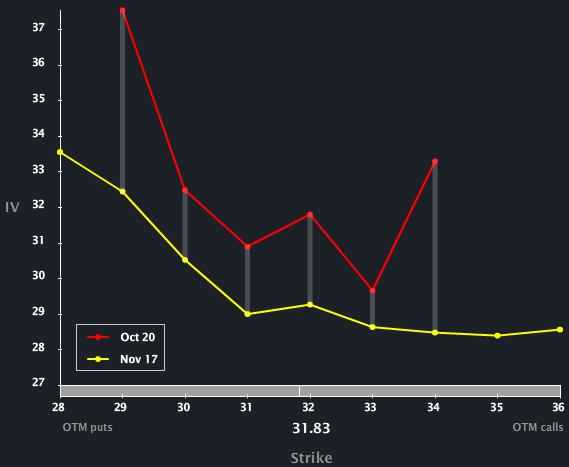
We can see how the front month is both (1) priced above the back expiry and (2) has developed an upside skew. In English, the option market reflects both more risk in the near-term than the intermediate-term and greater upside risk (potential) in the near-term.
I have included the Skew Tab from yesterday to demonstrate the change in the term structure in just one day.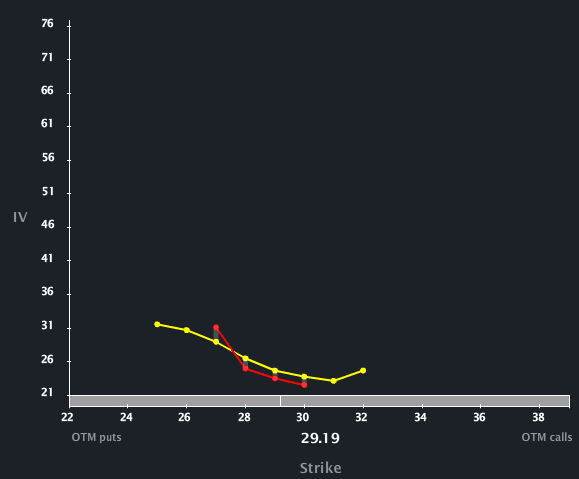
Note how the front was priced below the back (for most strikes) and how the front did not show an upside skew. In English, the news today has dramatically changed the term-structure (I think I already said that...).
Finally, the Charts Tab (six months) is below. The top portion is the stock price, the bottom is the vol (IV30™ - red vs HV20™ - blue vs HV180™ - pink).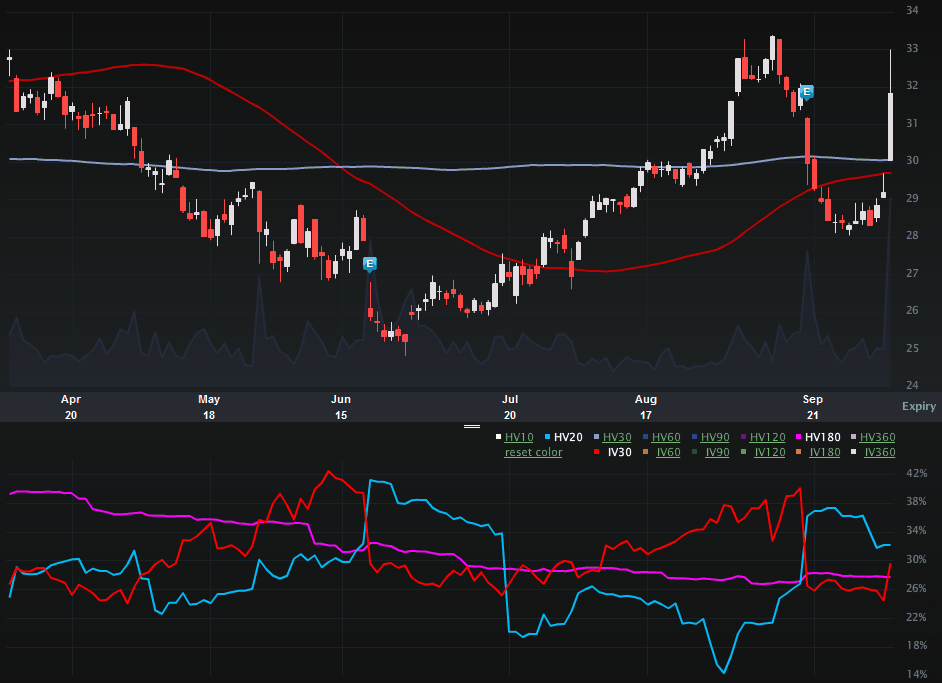
We can see the awesome move up over the last few trading days -- almost like the first few days were in anticipation of this news. On 10-3-2012 the stock closed at $28.32. As of this writing the stock is up 12.3% in the last five calendar days.
On the vol side we can see how the implied was in fact trading below both the short-term and long-term historical realized vols until today. The 52 wk range in IV30™ is [24.34%, 48.175], putting the current level in just the 21st percentile. I do find it compelling that the news today has pushed the stock, pushed the vol and disrupted the term structure, yet the IV30™ is still essentially in the bottom quintile. I also note the upside vol diff between Oct and Nov... hmmm....
DISCLAIMER: This is trade analysis, not a recommendation.
- English (UK)
- English (India)
- English (Canada)
- English (Australia)
- English (South Africa)
- English (Philippines)
- English (Nigeria)
- Deutsch
- Español (España)
- Español (México)
- Français
- Italiano
- Nederlands
- Português (Portugal)
- Polski
- Português (Brasil)
- Русский
- Türkçe
- العربية
- Ελληνικά
- Svenska
- Suomi
- עברית
- 日本語
- 한국어
- 简体中文
- 繁體中文
- Bahasa Indonesia
- Bahasa Melayu
- ไทย
- Tiếng Việt
- हिंदी
CarMax: Stock And Vol Rip On News; Risk Profile Changes
Published 10/09/2012, 03:05 AM
Updated 07/09/2023, 06:31 AM
CarMax: Stock And Vol Rip On News; Risk Profile Changes
3rd party Ad. Not an offer or recommendation by Investing.com. See disclosure here or
remove ads
.
Latest comments
Install Our App
Risk Disclosure: Trading in financial instruments and/or cryptocurrencies involves high risks including the risk of losing some, or all, of your investment amount, and may not be suitable for all investors. Prices of cryptocurrencies are extremely volatile and may be affected by external factors such as financial, regulatory or political events. Trading on margin increases the financial risks.
Before deciding to trade in financial instrument or cryptocurrencies you should be fully informed of the risks and costs associated with trading the financial markets, carefully consider your investment objectives, level of experience, and risk appetite, and seek professional advice where needed.
Fusion Media would like to remind you that the data contained in this website is not necessarily real-time nor accurate. The data and prices on the website are not necessarily provided by any market or exchange, but may be provided by market makers, and so prices may not be accurate and may differ from the actual price at any given market, meaning prices are indicative and not appropriate for trading purposes. Fusion Media and any provider of the data contained in this website will not accept liability for any loss or damage as a result of your trading, or your reliance on the information contained within this website.
It is prohibited to use, store, reproduce, display, modify, transmit or distribute the data contained in this website without the explicit prior written permission of Fusion Media and/or the data provider. All intellectual property rights are reserved by the providers and/or the exchange providing the data contained in this website.
Fusion Media may be compensated by the advertisers that appear on the website, based on your interaction with the advertisements or advertisers.
© 2007-2024 - Fusion Media Limited. All Rights Reserved.
