
Cardano (ADA) released the testnet for Cardano 1.5 on Mar 7, 2019. It is the final planned step of Stellar’s current development phase. Will Cardano’s evolution help the coin reach the moon?
Key Highlights For March 11, 2019.
- The price of Cardano (ADA) started an upward move on Mar 9.
- It is currently trading inside a symmetrical triangle.
- There are resistance areas near $0.0478 and $0.0518
- There are support areas near $0.0435 and $0.041
- There is a small amount of bearish divergence developing in the RSI.
Tracing The Support
The price of ADA on Binance is analyzed at 30-minute intervals from Mar 9 to Mar 11
The price made a low of $0.044 on Mar 9. A series of completed market cycles have occurred since. As prices dipped, each low was higher than the preceeding low. Tracing these lows gives us the ascending support line.
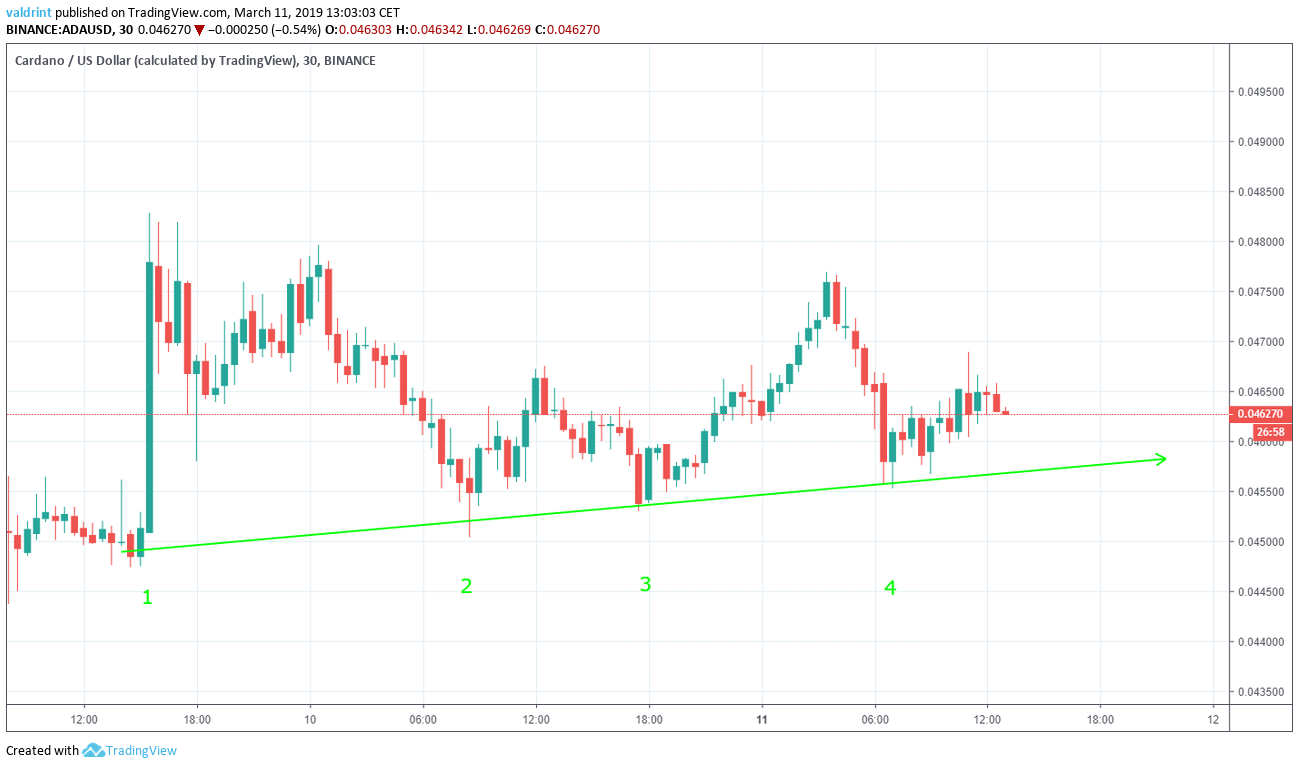
The dates on which the line was touched are Mar 9, Mar 10 (twice), and Mar 11.
The support line acts as floor predicting the lower end of prices over a period of time. If the price drops below the support for a sustained period, rapid price drops may follow.
ADA’s price has rarely fallen below the support between Mar 9 and 11—and these drops were fairly insignificant. On the contrary, prices have increased at or above the rate as predicted by the line during this period.
The support suggests a slight upward trend—meaning that the price of ADA may continue increasing at a steady rate predicted by the support. When the price will break from this support cannot be determined from the support alone.
Symmetrical Triangle
The price reached a high of $0.0482 on Mar 9. It has been making lower highs since. Tracing these highs gives us a descending resistance line.
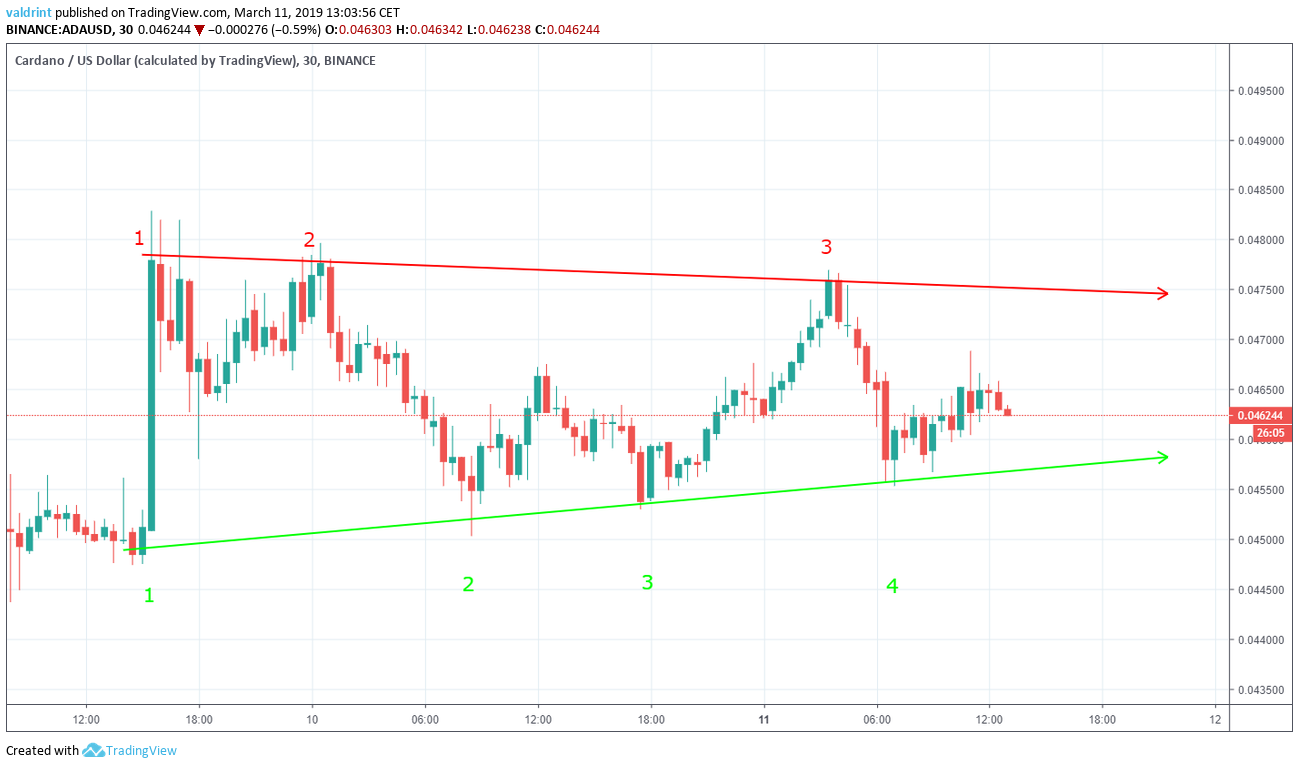
The dates on which the line was touched are Mar 9, Mar 10, and Mar 11.
The resistance line can act as a ceiling to price, preventing upward movement in the same way support acts as a ceiling. Furthermore, just as ADA saw insignificant drops below the support, it also experienced fairly insignificant rises above the support.
Neither these drops below support or rises above resistance were sustained—suggesting that ADA may continue trading within the symmetrical triangle created by the support and resistance.
Eventually, the resistance and support lines will converge. If ADA has not broken down below support or broken out of the resistance by this point, a breakdown or breakout will be forced. At this point, it is unclear which will occur.
Looking For Signs
The relative strength index (RSI) is an indicator which calculates the size of the changes in price in order to determine oversold or overbought conditions in the market.
Combining RSI bullish/bearish divergence with support/resistance essentially predicts price fluctuations.
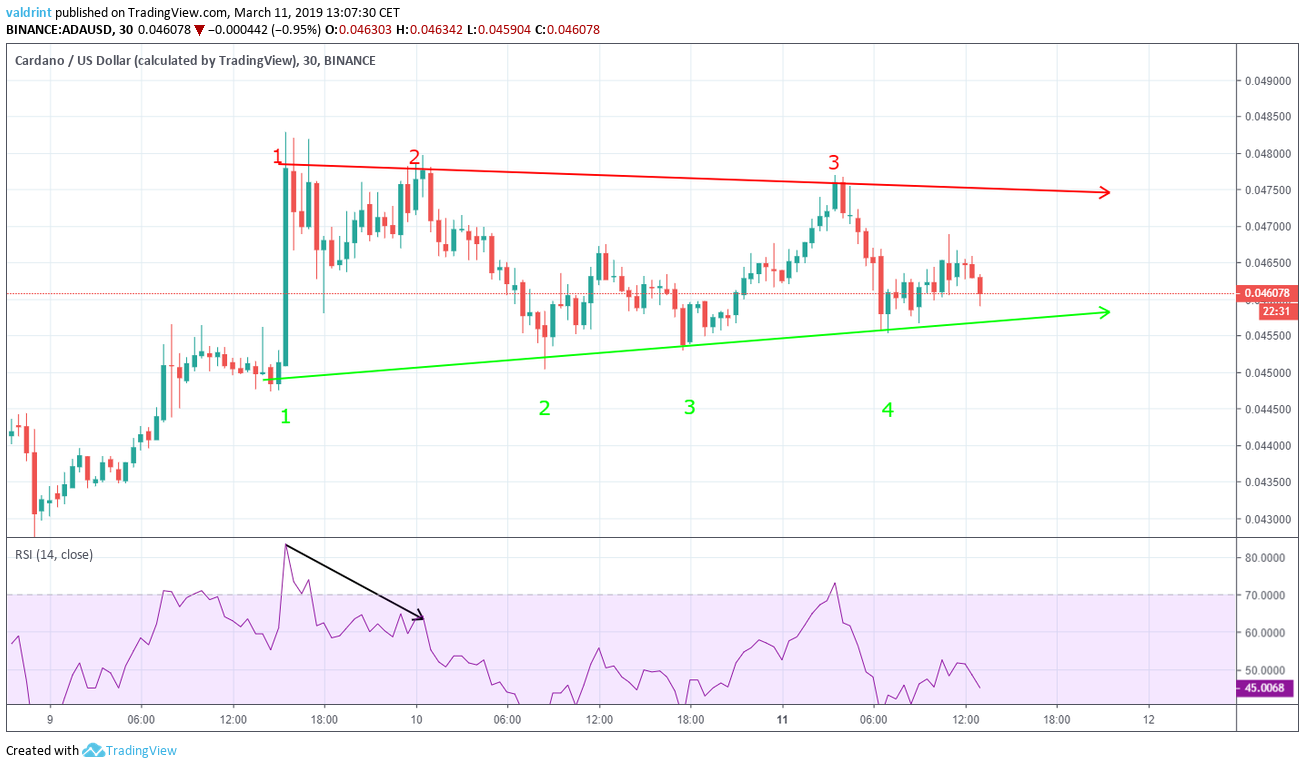
On Mar 9, the price made a high of $0.0482. It revisited levels close to it again the same day. Similarly, the RSI reached a high of 81 on Mar 9. However, on the second try, it reached a high of only 62.
This is called bearish divergence and often precedes drops in price.
It is especially effective if bearish divergence occurs in a bearish pattern and vice versa. This is not the case in ADA since the symmetrical triangle is a neutral pattern.
Using this indicator, it is not possible to say with certainty whether the price will make an upward or downward movement within the symmetrical triangle. Furthermore, a breakout or breakdown cannot be predicted by ADA’s currently neutral trading position.
Future Movement
The price of ADA on Binance is analyzed at six-hour intervals from Feb 5 to Mar 11 to better predicts possible future price levels.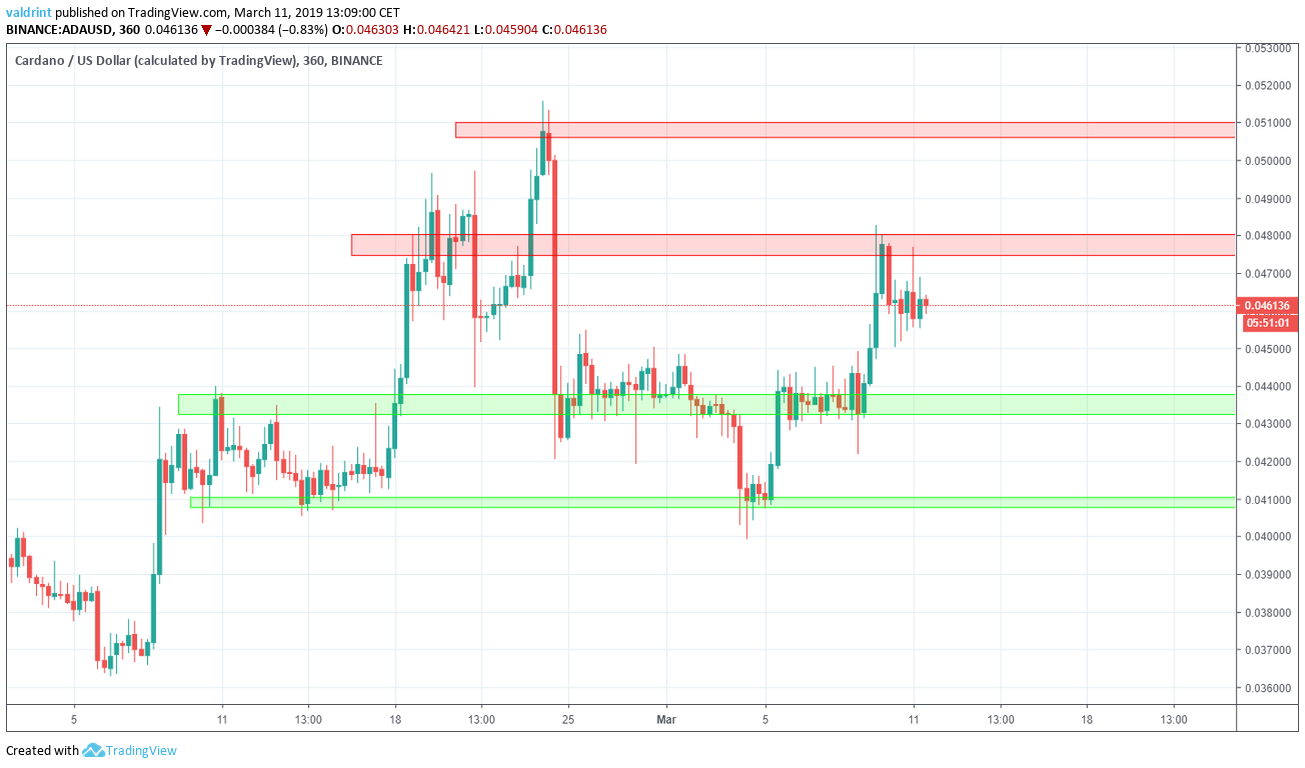
The closest resistance areas are found near $0.0478 and $0.0518. In the case of a breakout, these would provide likely reversal areas.
Conversely, the closest support areas are found near $0.0438 and $0.041. Price is likely to revisit at least one of these areas before making an upward move.
Summary of Analysis
Based on this analysis, the price of ADA is likely to trade inside the channel without a lot of volatility. If the price does not break out from the channel and trades between $0.0458 and $0.0475 the prediction will be validated.
Disclaimer: This article is not trading advice and should not be construed as such. Always consult a trained financial professional before investing in cryptocurrencies, as the market is particularly volatile.