
On June 4, 2019, the Cardano price (ADA) reached an hourly high of $0.88. A rapid decrease ensued and the price made lows of $0.82 the same day. A gradual increase was followed by a decrease. On June 10, the price made a low of $0.076.

Since then, the Cardano price has been increasing.
Will it reach highs above $0.1 again?
Cardano Price (ADA): Trends and Highlights for June 11, 2019
- Cardano reached a high on June 4.
- It is trading inside a descending channel.
- The 10- and 20-hour moving averages have made a bearish cross.
- The 10- and 20-day moving averages have made a bearish cross.
- There is support near $0.074.
Descending Channel
Cardano’s current pattern has been traced using the one-hour price of ADA/USD on Binance from June 4 to June 11.
On June 4, the Cardano price (ADA) reached an hourly high of $0.088. A rapid decrease began and the price made a low of $0.082 during the same day.
Since then, the price has been trading inside the descending channel outlined below:
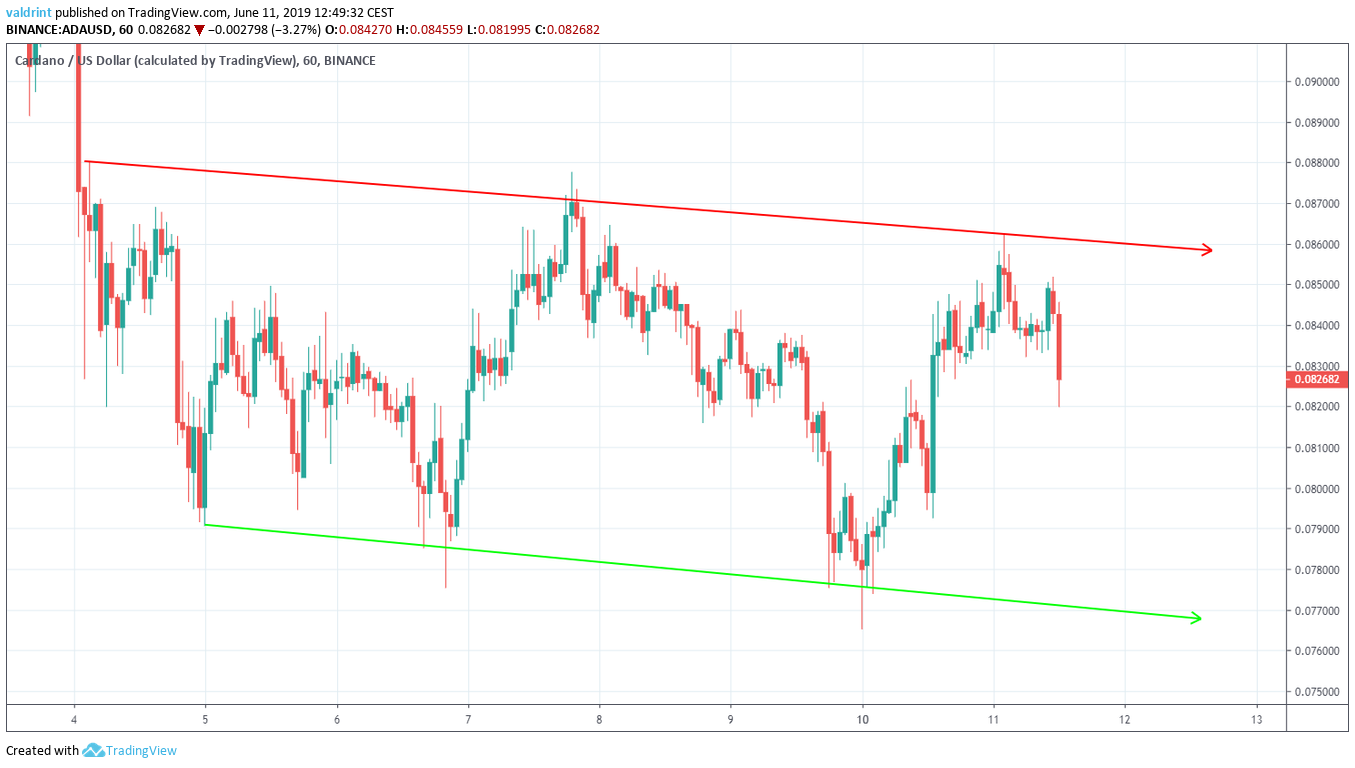
On June 7, the Cardano price (ADA) reached the resistance line of the channel before beginning a downward move towards the support line.
On June 11, it again reached the resistance line.
Will it begin another decrease towards the support line? Let’s look at technical indicators and find out
Technical Indicators
The Cardano price (ADA) is analyzed alongside the 10- and 20- period moving averages (MA) in an hourly time-frame (first graph) and daily time-frame (second graph)
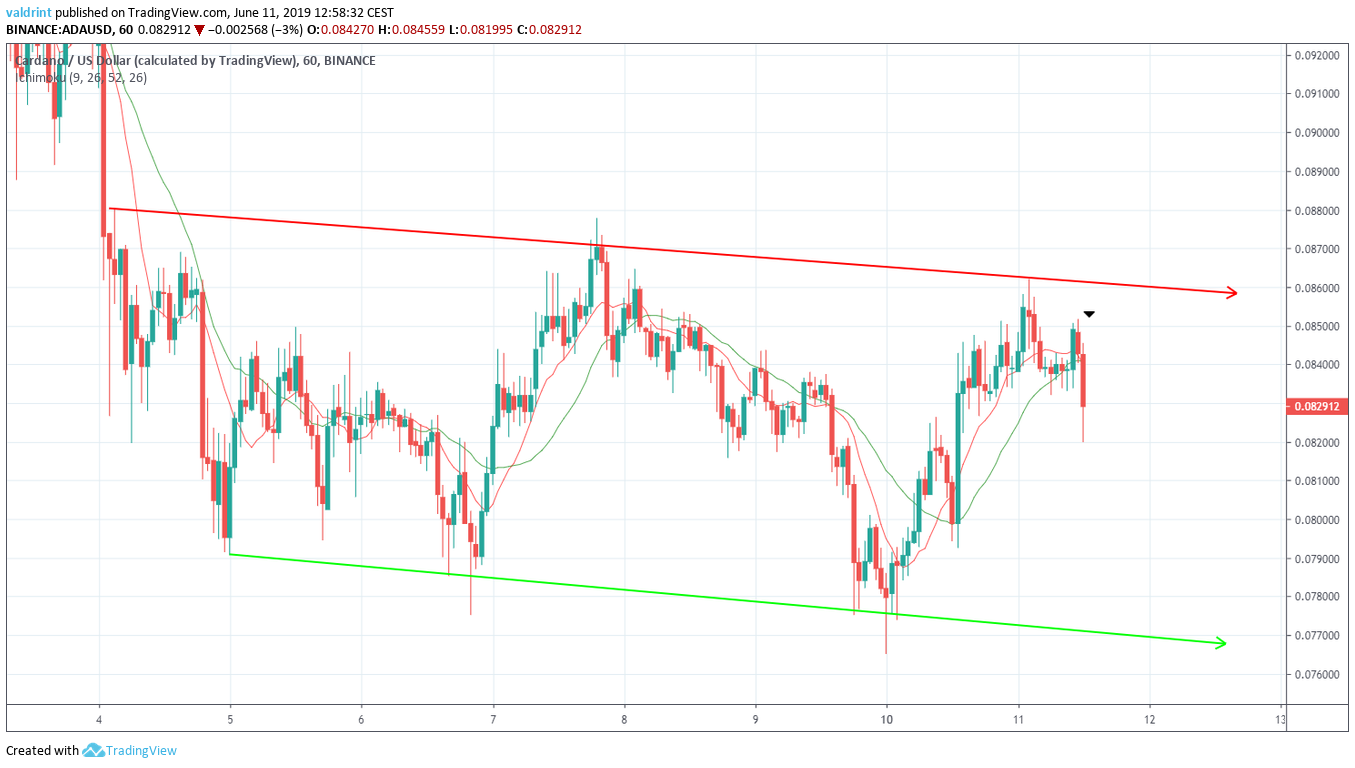
On June 11, the 10-period MA crossed below the 20-period one. This is known as a bearish cross and is often an indication that a downtrend has begun. However, as seen by the numerous bearish/bullish crosses inside the channel, it is a relatively short-term indicator.
However, the same has occurred in a daily time-frame:
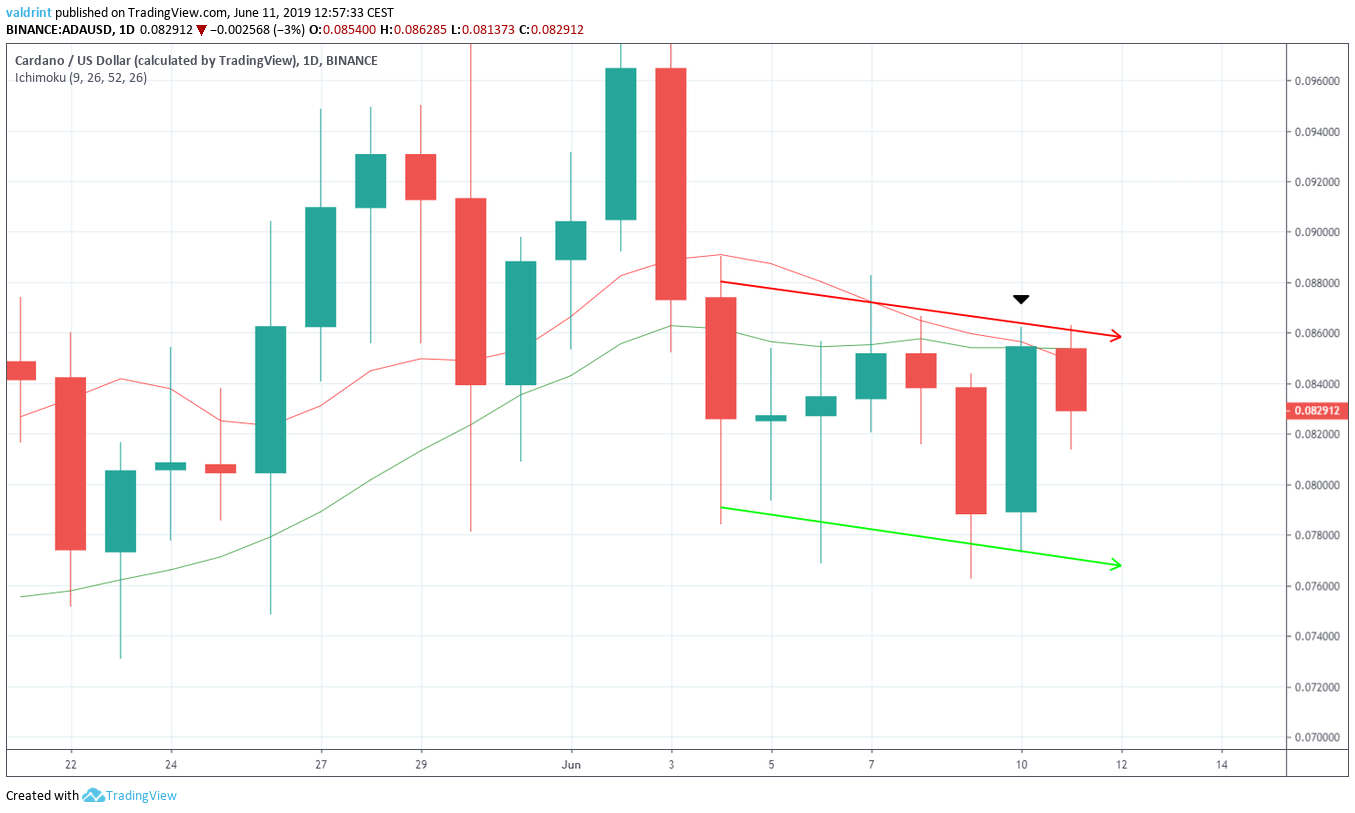
On June 10, the 10-day MA crossed below the 20-day one. Both MAs had previously offered resistance to the Cardano price (ADA) since June 3. An unsuccessful attempt at a breakout was made on July 7. Afterward, the price has been facing very close resistance from the 10-day MA.
The use of these indicators supports a price decrease towards the support line of the channel.
Cardano Price (ADA): Reversal Areas
One support area is traced for ADA/USD below:
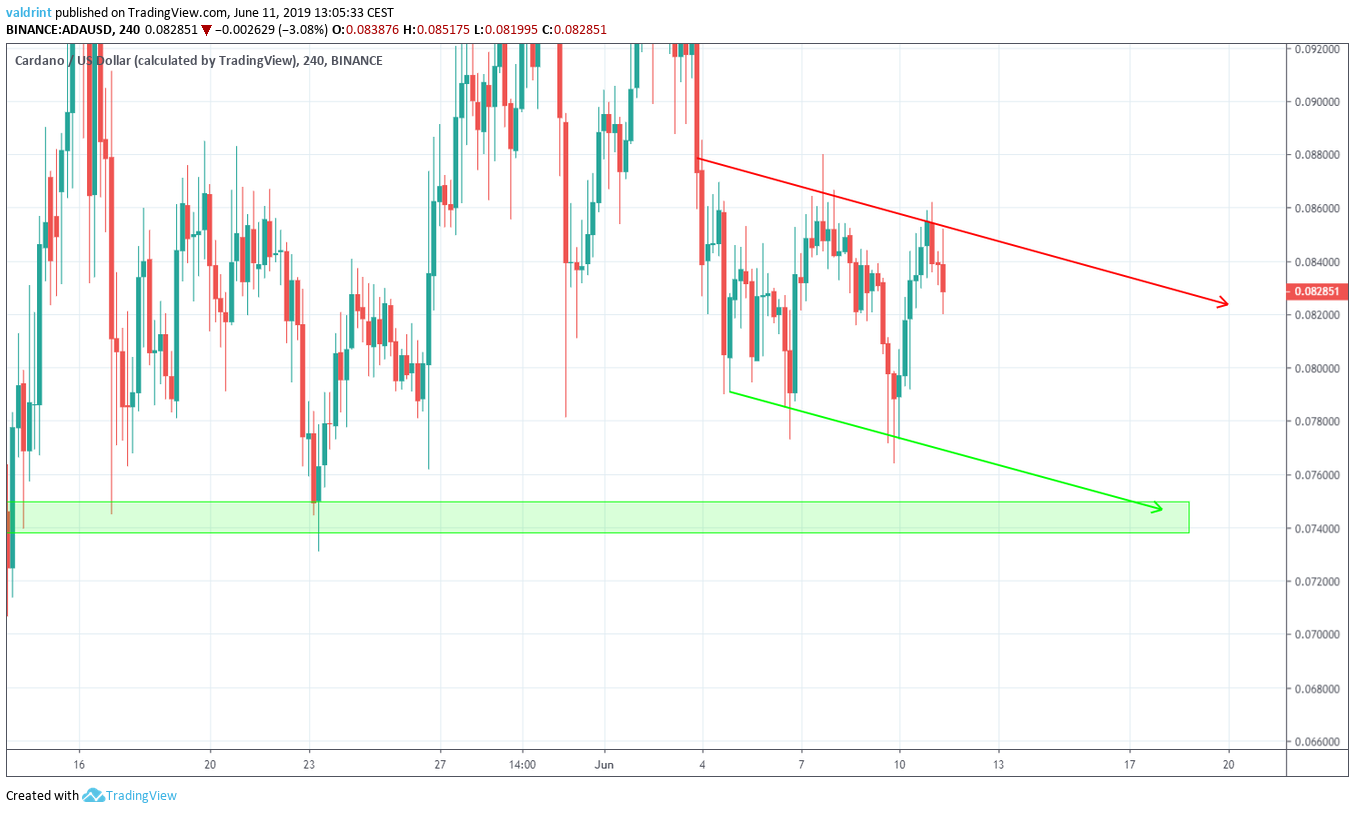
The closest support area is found near $0.074. If the price continues to decrease at the rate predicted by the channel, it is likely to reach this area on June 18. According to the technical indicators, this is likely to occur.
Summary
Based on our analysis, the Cardano price (ADA) will likely reach the support line of the short-term channel. A breakdown from the channel is possible. It is likely that the price will reach the support area outlined above.
Disclaimer: This article is not trading advice and should not be construed as such. Always consult a trained financial professional before investing in cryptocurrencies, as the market is particularly volatile.