Calculating market return and performance is important. You don’t want to do it on a daily basis, but it is important to measure how you are doing, keep track of whether you are achieving your goals, as well as keeping records for tax and various other reasons.
To keep it simple, I calculate my returns against the S&P 500 and Russell 2000.
Russell Investments has a calculator that makes it really easy to get the performance returns over any custom time period. Standard and Poors does a horrible job of calculating market returns. In fact, there is no way to calculate the total return with the data from the S&P 500.
But there is a workaround, and in response to the questions I received from my 2012 performance review about how I calculated market returns, follow these instructions to start calculating the market return for your own portfolio.
Calculate Market Returns Over Custom Period
Here is a link to the Russell Investments page for the market return calculator.
[The following method is a tip I received from Twitter]
To get the market return of the S&P500, we are going to use Morningstar.
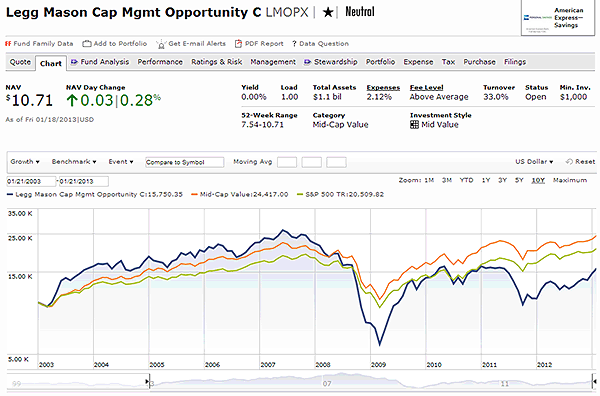
1. You have to first enter a fund and then go to the chart tab. Here is a link that I use for the Legg Mason fund. Below is the page you see when you load the site.
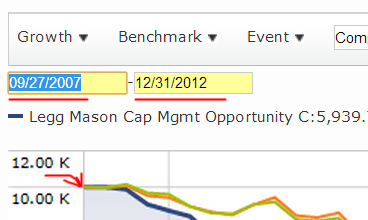
2. Enter the custom dates into the boxes you see like below. I entered my starting date as Sep 27, 2007 and ending date 12/31/2012 to calculate the market return from my starting date to end of 2012.
When you do this, the graph will automatically realign the graph axis to start at a value of $10,000. This makes it easy to calculate the benchmark returns.
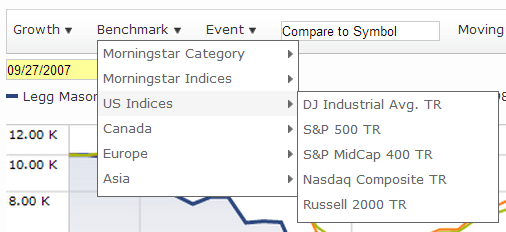
3. Next step is to add the benchmarks you want to compare against. Click the “benchmark” drop down list and select the ones that takes your fancy.
You can use any of the benchmarks Morningstar offers, but I will stick with the S&P 500 total return and Russell 2000 total return for this exercise.
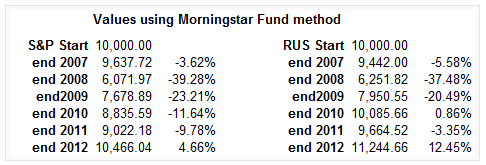
4. Then you will notice that the S&P and Russell has been included. The main information you need is shown in red below.
In this example
- the period is from Sep 27, 2007 to Dec 31, 2012
- starting value is 10,000
- ending S&P total return is 10,466.04
- ending Rus2k total return is 11,244.66
With this you can immediately calculate that the S&P500 returned 4.66% and the Rus2k returned 12.45% over the same period.
5. Organize it nicely into a spreadsheet like below to keep track on a yearly or even monthly basis.
Calculating Your Own Portfolio Performance
Now that you know how to calculate market returns, you can do something similar to calculate your portfolio using the XIRR function in excel or this link will take you to a simple google docs version that another person created.
Please Share if You Find this Useful
If you find this useful, please help out Old School Value by sharing this article using the social sharing buttons.
The more you share, the more I know what type of content you really like and I will be able to provide more quality content.
