In 2013, I had a bearish view of the stock market due to extremely bullish sentiment readings. The market completely ignored that, made a major breakout through 13-year resistance and continued running for years.
Lesson learned.
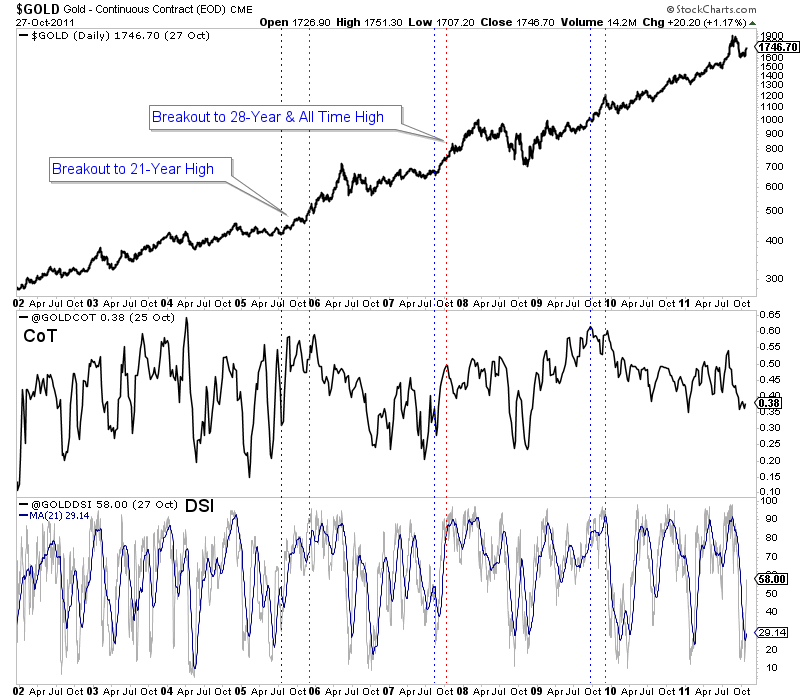
Turning to Gold, we find something similar during major breakouts in 2005, 2007 and 2009. In the chart below we plot Gold along with its net speculative position (as a percentage of open interest) and the widely followed daily sentiment index.
In August 2005 and the start of 2006, the net speculative position in Gold reached (excluding 2004) what were the highest levels since the start of the data in 1987.
In late 2007, the net speculative position was not at an extreme but the daily sentiment index spent quite a bit of time around 90% bulls immediately prior to Gold breaking out to a new all-time high.
Both the net speculative position and daily sentiment index were very elevated in the fall of 2009, immediately prior to Gold breaking out above its 2008 peak. The net speculative position then was at its second-highest level since 1987.
As of February 5, when the Gold price closed at $1319/oz, the net speculative position in Gold was 27% of open interest. Gold gained $30/oz since then but that is well below the 55%-60% peak levels seen in 2016, 2012, 2009 and 2004-2006.
While that is encouraging, history shows that if and when Gold breaks its resistance ($1375-$1400/oz) sentiment indicators figure to be close to bullish extremes. When a market is coming out of a bad bear market or on the cusp of a multi-year breakout, bullish sentiment isn’t necessarily bearish.
In fact, a market that cannot register bullish sentiment extremes is one that may not be strong enough to break out.
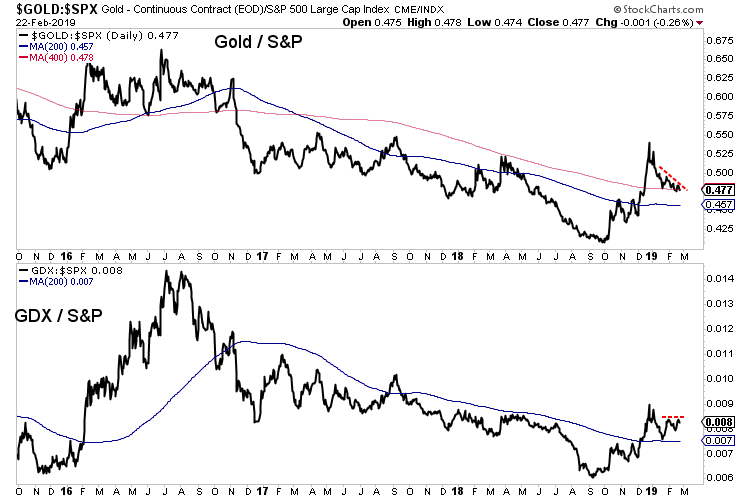
Circling back to the present, the one thing that can prevent Gold from breaking out is renewed underperformance against the stock market. In the chart below we plot Gold and GDX (NYSE:GDX) against the S&P 500.
Precious metals stopped outperforming the stock market in late December and the Gold to S&P 500 ratio appears weak and likely to weaken further.
The S&P 500 recently cleared its moving average resistance and its advance-decline line hit a new all-time high. These things suggest higher prices in the near future and that, rather than bullish sentiment would provide resistance to Gold over the next few months.
Although Gold will not break resistance in that scenario, we should keep an eye on the gold stocks which have shown improving the breadth and relative strength. Plenty of great values remain and there is still plenty of time to position yourself to take advantage. If a huge breakout is coming later in the year then the next few months may be your last chance.


