Trading recommendations
Sell Stop 55.30. Stop-Loss 56.80. Take-Profit 54.40, 54.00, 53.70, 53.00, 52.25, 50.70, 50.00
Buy Stop 56.80. Stop-Loss 55.80. Take-Profit 57.50, 58.00, 59.00, 60.00, 61.00
Overview and Dynamics
Since the beginning of the current trading week, oil prices fell, however, by two factors - the collapse of the dollar in the foreign exchange market after the show Donald Trump on Wednesday at his first press conference and reports that Saudi Arabia cut production more than agreed originally - back on the positive dynamics of oil prices.
Rising oil prices did not stop even reported growth in US stocks. At the end of the week January 31 on December 6 commercial US crude stocks rose by 4.097 million barrels to 483.11 million barrels. Gasoline stocks rose by 5 million barrels, while distillate stocks - by 8.4 million barrels.
Futures for Brent crude rose 91 cents, or 1.7%, to 56.01 dollars per barrel. Spot price for Brent oil at the beginning of today's European session is near the level of 56.30 dollars per barrel. However, in today's Asian trading session on the financial markets seen flat after a strong volatility during the previous two days, which arose after the speech of Donald Trump.
In general, news about the transaction and the 11 OPEC countries outside the cartel, in which the world supply of oil to be reduced by approximately 2%, has the major impact on oil prices. OPEC's agreement came into force in January and be subject to revision in six months. In the meantime, a preliminary agreement on the willingness of participants to reduce oil production to fulfill the obligations is quite high. Agreement OPEC returned oil prices above $ 50 per barrel. However, against the background of the United States under this agreement reduction of oil production can increase production. And it will be a negative factor for oil prices. Oil production in the country last week rose by another 176,000 barrels a day to 8.95 million barrels a day, its highest level since mid-April last year.
The growth of the US oil supply in the market may also encourage the country's cartel exceed the established production quotas, which can return the oil prices in a downward trend.
Today at 18:00 (GMT) will be published data from oilfield services company Baker Hughes on the number of active drilling rigs in the United States. This report is an important indicator of the activity of the oil sector of the US economy and significantly affects the quotations of oil prices. At the moment, the number of active drilling rigs in the United States is 529 units. The number of plants growing in June for several months after oil prices exceeded the level of 40 dollars per barrel (this, according to various estimates, the approximate level of profitability of oil production, including shale oil in the US). Investors are closely watching the level of drilling activity and production in the United States. The high prices may further spur the growth of drilling rigs and production in the country, which may limit the oil price rally.
Technical analysis
Since the end of November, when OPEC agreed to reduce production within the cartel by 1.2 million barrels a day, the price of Brent crude consolidated to date, about 20%, rebounding from the level of 47.25 dollars per barrel.
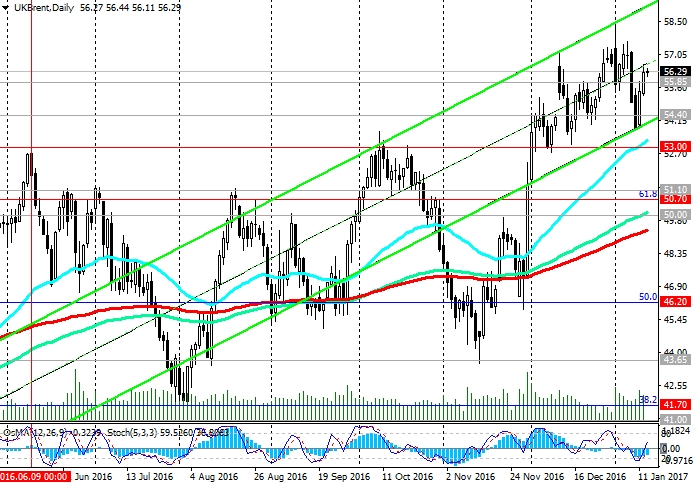
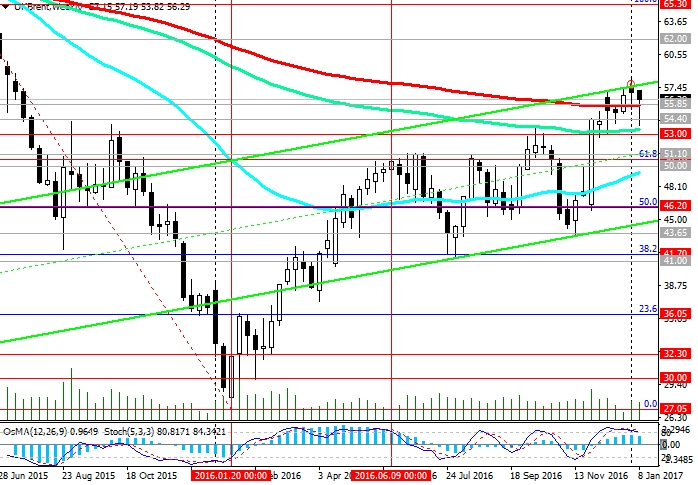
Indicators OsMA and Stochastic on the daily, weekly, monthly schedules are on the side of buyers. On the 1-hour and 4-hour chart indicators are developed for short positions, indicating a possible correction and reduction. Downward correction Goals - 55.85 (EMA200 1 hour and EMA50 on the 4-hour chart), 54.40 (EMA200 on 4-hour chart), 53.00 (the lower limit of the downward channel on the 4-hour chart, the high of June, October lows of December). Nevertheless, the fundamental backdrop conduces to further growth of oil prices. On the weekly chart, the price broke the important resistance level of 55.85 (EMA200) and remains within the rising channel near its upper border. In the medium term is likely price movement to the level of 62.00 (EMA144, EMA200 monthly chart).
Alternative scenario implies a decline of oil prices in the event of problems or difficulties in the implementation of the OPEC agreement to cut production on the background growth of the dollar, stocks and oil production in the United States.
Critical for the new uptrend may be a refund of the price below the level of 53.00. Return prices below the levels of the zone 51.10, 50.70 will increase the risks to further reduce the key support level of 50.00 (EMA200 on the daily chart).
Support levels: 55.85, 54.40, 53.70, 53.00, 52.25, 51.10, 50.70, 50.00
Resistance levels: 57.50, 58.00, 60.00, 61.00, 62.00


