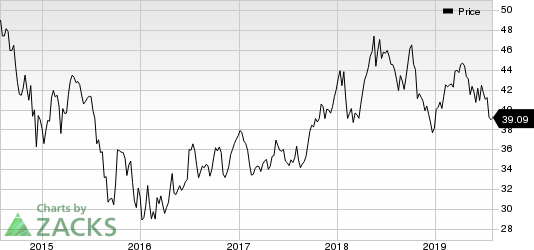
BP plc (LON:BP) (NYSE:BP) reported second-quarter 2019 adjusted earnings of 83 cents per American Depositary Share (ADS) on a replacement cost basis, excluding non-operating items. The bottom line surpassed the Zacks Consensus Estimate of 78 cents but deteriorated from the year-ago quarter’s figure of 85 cents.
Total revenues of $73,747 million declined from $76,907 million in the year-ago quarter and missed the Zacks Consensus Estimate of $79,786 million.
Oil equivalent volumes from key upstream projects along with higher refining marker margin primarily contributed to better-than-expected earnings. This was offset partially by the lower realized commodity prices.
Operational Performance
Upstream
In the second quarter, total production of 2.625 million barrels of oil equivalent per day (MMBoe/d) was higher than 2.465 MMBoe/d in the year-ago quarter. Key upstream projects primarily drove quarterly production volumes.
The company sold liquids at $62.63 a barrel in the second quarter compared with $67.24 in the prior-year quarter. Moreover, it sold natural gas at $3.35 per thousand cubic feet compared with $3.65 in the year-ago quarter. Overall price realization fell to $40.64 per barrels of oil equivalent (Boe) from the year-ago quarter’s level of $43.37.
After adjusting for non-operating items and fair value accounting effects, underlying replacement cost profit before interest and tax for the segment amounted to $3,413 million. The figure deteriorated from $3,508 million in the year-ago quarter. Lower realized prices from oil equivalent barrels of liquids primarily caused the downside.
Downstream
Segmental profits declined to $1,365 million from $1,455 million in the year-ago quarter, thanks to lower refinery throughput. The downtick partially offset by higher refining marker margin.
Refining marker margin of $15.2 per barrel in the second quarter was higher than $14.9 in the year-earlier quarter. However, total refinery throughput decreased to 1,597 thousand barrels a day (MB/d) from 1,680 MB/d in the prior-year quarter.
Refining availability was 93.4% compared with 93.1% in year-earlier quarter.
Rosneft
Profits in the segment amounted to $638 million, down from $766 million in the year-ago quarter.
Financials
BP's net debt including leases was $56,650 million at the end of the second quarter, higher than $39,277 million in the prior-year quarter. Gearing was recorded at 31%, up from 27.5% in the prior-year quarter.
Oil Spill Costs
Through the first half of 2019, the integrated energy firm made a payment of $2.1 billion, after tax, associated with the oil spill incident in the Gulf of Mexico. BP continues to project oil spill payment of nearly $2 billion for 2019.
Outlook
The company anticipates oil and natural gas production in the third quarter of 2019 to be lower sequentially. BP also projects industry refining margins to decline through the September quarter.
Zacks Rank & Key Picks
BP currently carries a Zacks Rank #3 (Hold).
Some better-ranked players in the energy space include MPLX LP (NYSE:MPLX) , Oasis Midstream Partners LP (NYSE:OMP) and Plains Group Holdings, L.P. (NYSE:PAGP) . All the stocks sport a Zacks Rank #1 (Strong Buy).You can see the complete list of today’s Zacks #1 Rank stocks here.
MPLX is likely to see earnings growth of 23.6% through 2019
Oasis Midstream posted an average positive earnings surprise of 0.3% in the last four quarters.
Plains Group is likely to see earnings growth of 7.6% through 2019.
Today's Best Stocks from Zacks
Would you like to see the updated picks from our best market-beating strategies? From 2017 through 2018, while the S&P 500 gained +15.8%, five of our screens returned +38.0%, +61.3%, +61.6%, +68.1%, and +98.3%.
This outperformance has not just been a recent phenomenon. From 2000 – 2018, while the S&P averaged +4.8% per year, our top strategies averaged up to +56.2% per year.
See their latest picks free >>
BP p.l.c. (BP): Free Stock Analysis Report
MPLX LP (MPLX): Free Stock Analysis Report
Plains Group Holdings, L.P. (PAGP): Free Stock Analysis Report
Oasis Midstream Partners LP (OMP): Free Stock Analysis Report
Original post
Zacks Investment Research

