
Booz Allen Hamilton Holding Corporation (NYSE:BAH) reported mixed second-quarter fiscal 2019 results, wherein the company’s earnings surpassed the Zacks Consensus Estimate but revenues missed the same.
Adjusted earnings per share (EPS) of 68 cents beat the consensus mark by 8 cents and improved on a year-over-year basis. The bottom line benefited from revenue growth, improved margins, lower tax rate and positive impact of 18 cents due to lower diluted share count.
Total revenues of $1.61 billion lagged the consensus estimate by $26 million but increased 4.6% year over year. The top line was driven by a year-over-year decline in billable expenses. Notably, billable expenses accounted for 29.6% of revenues in the reported quarter.
Revenues excluding billable expenses were $1.14 billion, up 7.2% on a year-over-year basis. Booz Allen earns the maximum amount of profit from revenues, excluding billable expenses.
Book-to-bill ratio was 3.66 (up 35.6% y/y) for the reported quarter, recording the highest level since the company's IPO. Total backlog increased 28.1% from the prior-year quarter to $21.37 billion. While funded backlog of $4.18 billion improved 16.5%, unfunded backlog grew 23.7% to $4.77 billion. Priced options went up 34.4% to $12.41 billion.
The impressive performance on bookings implies an upward trend in buying through the end of the government's fiscal year and rising clients’ demand for mission-focused technology solutions provided by Booz Allen.
Headcount of 25,344 increased 4.6% year over year, reflecting the company’s strength in hiring in second-quarter fiscal 2019. Given this strength in hiring and continuous demand for talent, Booz Allen is hopeful of reaching or surpassing its headcount growth target of 5%.
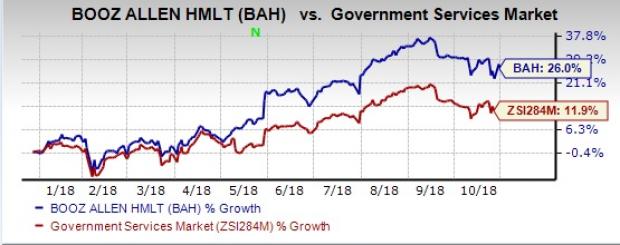
So far this year, shares of Booz Allen Hamilton have gained 26%, outperforming 11.9% growth recorded by the industry it belongs to.
Operating Results
Adjusted EBITDA of $163.83 million increased 10% year over year. Adjusted EBITDA margin rose to 10.2% from 9.7% in the year-ago quarter. The marginal growth was driven by strong contract level performance, lower than anticipated billable expense ratio, solid cost management and timing of certain cost recoveries.
Adjusted operating income was $147.41 million, up 10.9% year over year. Adjusted operating income margin on revenues was 9.1% compared with 8.6% in the year-ago quarter.
Total operating costs and expenses increased 4.3% year over year to $1.47 billion.
Booz Allen Hamilton Holding Corporation Price, Consensus and EPS Surprise
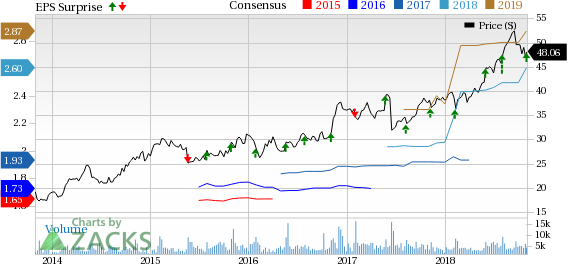
Booz Allen Hamilton Holding Corporation Price, Consensus and EPS Surprise | Booz Allen Hamilton Holding Corporation Quote
Balance Sheet & Cash Flow
Booz Allen exited second-quarter fiscal 2019 with cash and cash equivalents of $342.59 million compared with $149.72 million at the end of the prior quarter. Long-term debt (net of current portion) was $1.72 billion compared with $1.74 billion at the end of the prior quarter.
The company generated $301.6 million of net cash from operating activities in the reported quarter. Free cash flow was $282.39 million. Capital expenditures were $19.2 million.
The company declared a quarterly cash dividend of 19 cents per share, payable on Nov 30, to stockholders of record as of Nov 14. The company paid dividends worth $27.22 million and repurchased shares worth $44.53 million in the reported quarter.
Fiscal 2019 Outlook
For fiscal 2019, Booz Allen reaffirmed its guidance for revenue growth and raised the same for adjusted EPS. The company continues to expect revenue growth of 6-8%.
Adjusted EPS is anticipated in the range of $2.55-$2.65 compared with $2.35-$2.50 mentioned earlier. The upward EPS guidance is based on fiscal 2019 estimated average diluted shares outstanding of 141-144 million and an expected effective tax rate of 24-26%. The Zacks Consensus Estimate of $2.51 is below the currently guided range.
Zacks Rank & Upcoming Releases
Booz Allen currently carries a Zacks Rank #2 (Buy). You can see the complete list of today’s Zacks #1 Rank (Strong Buy) stocks here.
Investors interested in the broader Business Services sector are keenly awaiting third-quarter earnings reports from key players like Genpact (NYSE:G) , Delphi Technologies (NYSE:DLPH) and Green Dot (NYSE:G) . While Genpact will report on Nov 6, Delphi Technologies and Green Dot will release their quarterly results on Nov 7.
3 Medical Stocks to Buy Now
The greatest discovery in this century of biology is now at the flashpoint between theory and realization. Billions of dollars in research have poured into it. Companies are already generating revenue, and cures for a variety of deadly diseases are in the pipeline.
So are big potential profits for early investors. Zacks has released an updated Special Report that explains this breakthrough and names the best 3 stocks to ride it.
Delphi Technologies PLC (DLPH): Free Stock Analysis Report
Genpact Limited (G): Free Stock Analysis Report
Green Dot Corporation (GDOT): Free Stock Analysis Report
Booz Allen Hamilton Holding Corporation (BAH): Free Stock Analysis Report
Original post
Zacks Investment Research