
BOK Financial Corporation’s (NASDAQ:BOKF) second-quarter 2017 earnings per share of $1.35 surpassed the Zacks Consensus Estimate of $1.31. Moreover, the bottom line jumped 35% from the prior-year quarter.
Results were primarily driven by higher net interest income. Higher loan balances was the key driver. Also, the absence of provisions acted as tailwind.
However, an increase in nonperforming assets and lower fees and commissions revenues perhaps disappointed investors. As a result, the stock lost 3% after the announcement.
Net income attributable to common shareholders came in at $88.1 million, up 33.9% from $65.8 million in the year-ago quarter.
Revenues Rise, Costs Decline
Revenues came in at $387.5 million, up 5.2% year over year. Moreover, the figure surpassed the Zacks Consensus Estimate of $384.5 million.
Net interest revenue came in at $205.2 million, up 12.4% year over year. Net interest margin (NIM) also expanded 26 basis point year over year to 2.89%.
BOK Financial’s fees and commissions revenues amounted to $177.5 million, down 1.5% on a year-over-year basis. The quarter witnessed growth in several income categories, partially offset by lower mortgage banking, and brokerage and trading revenues.
Total other operating expenses were $250.9 million, down slightly year over year. The decline can be attributed to a significant reduction in insurance costs.
Total loans as of Jun 30, 2017 were $17.0 billion, almost stable compared with the prior quarter. As of the same date, total deposits amounted to $22.3 billion, down nearly 1.2% from the prior quarter.
Credit Quality: A Mixed Bag
The company did not record any provisions during the quarter. Also, charge-offs were down 77.8% on a year-over-year basis to $1.6 million.
Further, the combined allowance for credit losses was 1.49% of outstanding loans as of Jun 30, 2017, down from 1.54% in the year-ago period.
However, non-performing assets totaled $365.5 million or 2.12% of outstanding loans and repossessed assets as of Jun 30, 2017, up from of $350 million or 2.13% in the prior-year period.
Capital Position
Armed with healthy capital ratios, BOK Financial and its subsidiary banks exceeded the regulatory well-capitalized level. The company was subject to new regulatory rules on Jan 1, 2015. As of Jun 30, 2017, the common equity Tier 1 capital ratio was 11.76%.
Tier 1 and total capital ratios on Jun 30, 2017 were 11.76% and 13.37%, respectively, compared with 11.86% and 13.51% as of Jun 30, 2016. Leverage ratio was 9.26% compared with 9.06% as of Jun 30, 2016.
Our Viewpoint
BOK Financial’s consistent revenue growth keeps us optimistic about the stock. Moreover, continued growth in loan balances indicates an efficient organic growth strategy. Its diverse revenue mix and favorable geographic footprint should keep supporting growth in the upcoming quarters. However, elevated expenses remain a concern.
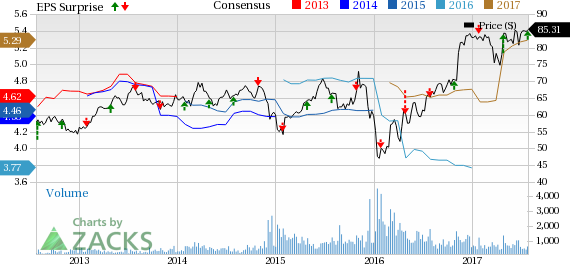
BOK Financial Corporation Price, Consensus and EPS Surprise
Currently, BOK Financial carries a Zacks Rank #2 (Buy). You can see the complete list of today’s Zacks #1 (Strong Buy) Rank stocks here.
Performance of Other Banks
Regions Financial Corporation’s (NYSE:RF) second-quarter 2017 earnings from continuing operations of 25 cents per share surpassed the Zacks Consensus Estimate by a penny. Also, the figure came in 25% higher than the prior-year quarter.
First Horizon National Corporation (NYSE:FHN) reported second-quarter 2017 adjusted earnings per share of 27 cents, surpassing the Zacks Consensus Estimate by a penny. Further, the figure reflects an increase of 12.5% from the year-ago quarter.
Bank of the Ozarks, Inc.’s (NASDAQ:OZRK) second-quarter 2017 earnings of 73 cents per share came in line with the Zacks Consensus Estimate. The figure improved 21.7% on a year-over-year basis.
More Stock News: Tech Opportunity Worth $386 Billion in 2017
From driverless cars to artificial intelligence, we've seen an unsurpassed growth of high-tech products in recent months. Yesterday's science-fiction is becoming today's reality. Despite all the innovation, there is a single component no tech company can survive without. Demand for this critical device will reach $387 billion this year alone, and it's likely to grow even faster in the future.
Zacks has released a brand-new Special Report to help you take advantage of this exciting investment opportunity. Most importantly, it reveals 4 stocks with massive profit potential. See these stocks now>>
Regions Financial Corporation (RF): Free Stock Analysis Report
First Horizon National Corporation (FHN): Free Stock Analysis Report
Bank of the Ozarks (OZRK): Free Stock Analysis Report
BOK Financial Corporation (BOKF): Free Stock Analysis Report
Original post