
Bitcoin (BTC) has surged over the last few days with a high of nearly $8200 reached on May 14. Have Litecoin (LTC) and Bitcoin Cash (BCH) been surging too?
To answer this question, we examine the current long-term and short-term trading patterns of Bitcoin (BTC), Bitcoin Cash (BCH) and Litecoin (LTC).
After comparing their technical indicators, we generate possible trade setups. Then our major findings are summarized. In conclusion, the winner of this analysis is selected based on future price potential.
Ascending Support
On Apr 3, the price of BTC/USD reached a high of $5335.5 and a low of $4842. Resistance and support lines are traced from this date to generate the ascending channel outlined in the graph below:
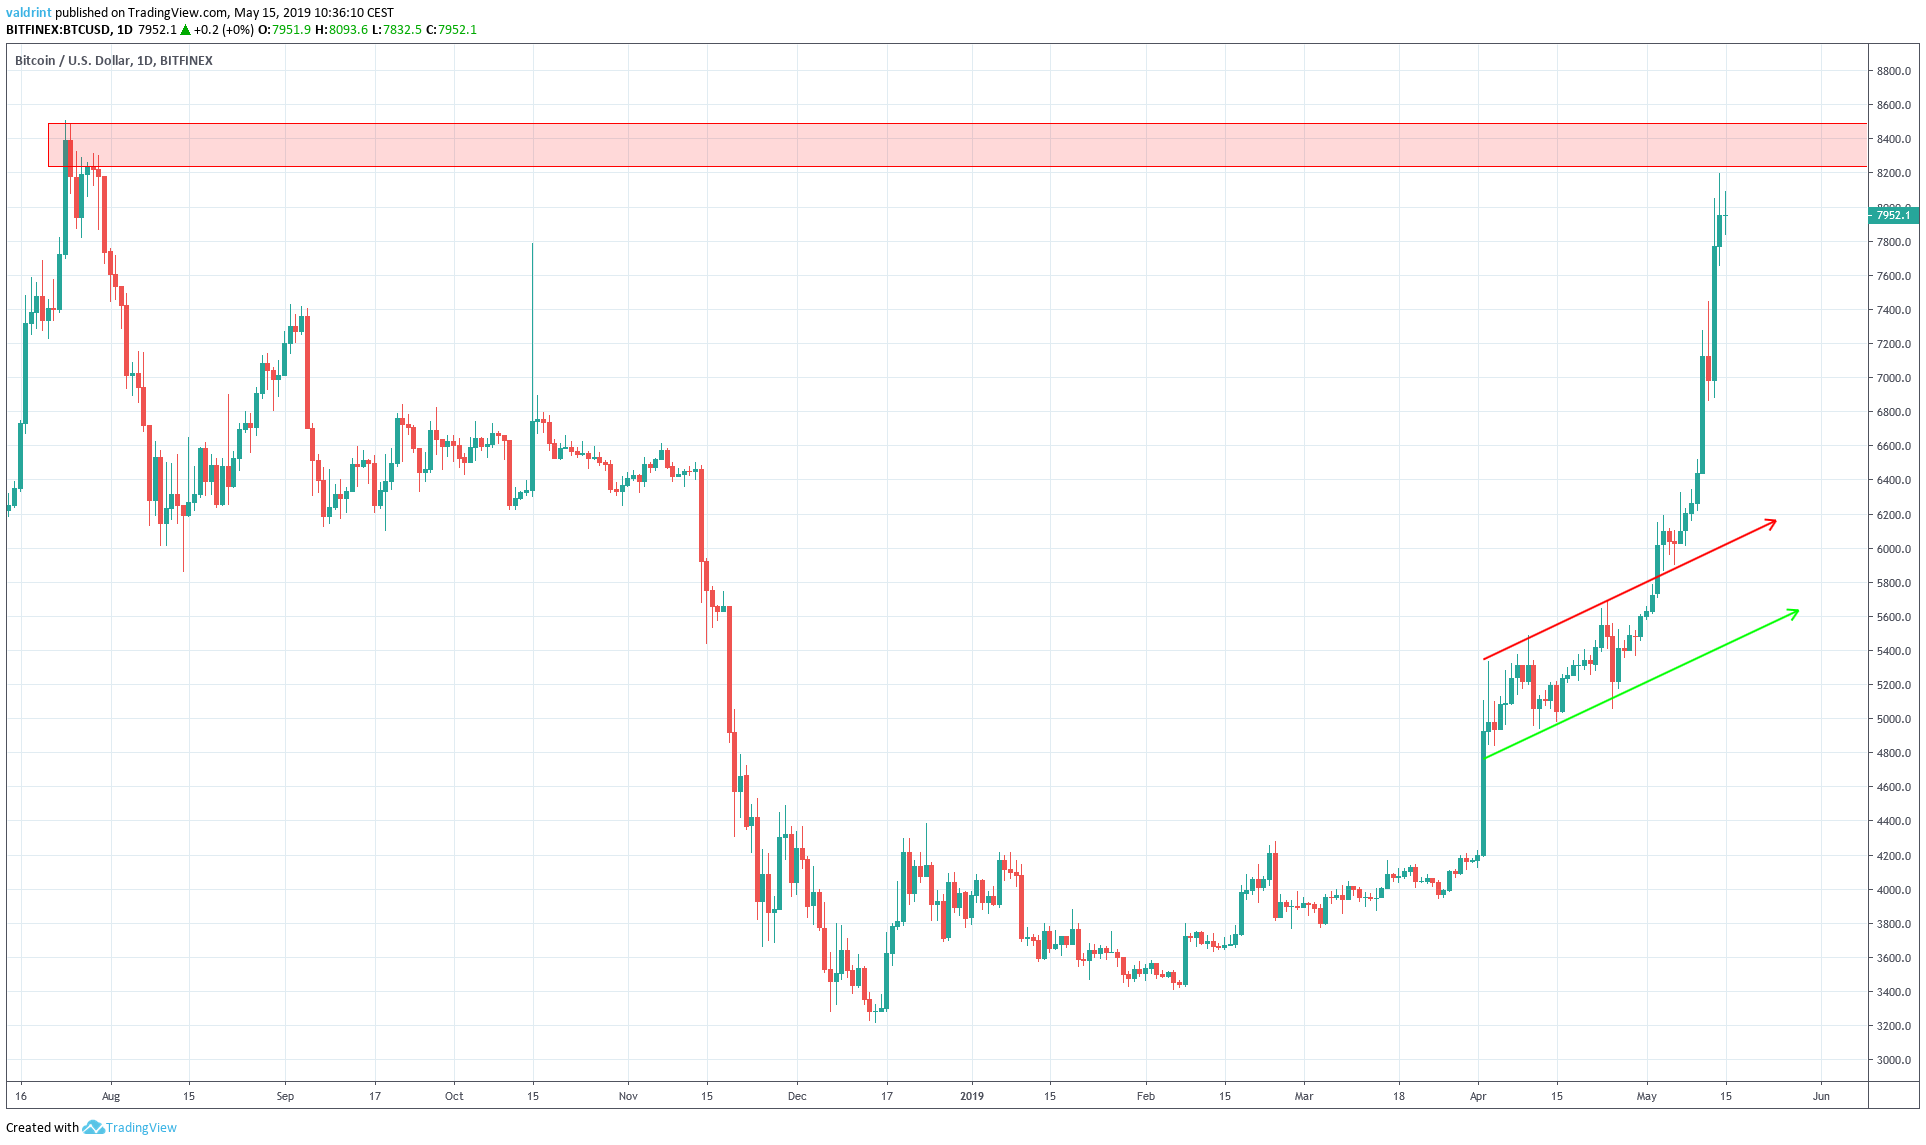
The price broke out from the channel on May 5th. A rapid increase began and the price reached highs of $8194.1 on May 14.
The price is very close to the major resistance area of $8300-$8500 created by the highs of July 2018.
The daily candles have been characterized by long upper wicks, indicating that there is selling pressure in the market. However, excluding May 12, the past 9 daily candles have been bullish.
The price of LTC/USD, however, has been following an ascending support line since making lows of $53.4 on Mar 12.
The increase intensified on Apr 2 and the price reached a high of $99.4 on Apr 3. After reaching similar levels on Apr 6, it began a gradual descent and validated the support line on May 1.
The price is trading inside the ascending triangle outlined below:
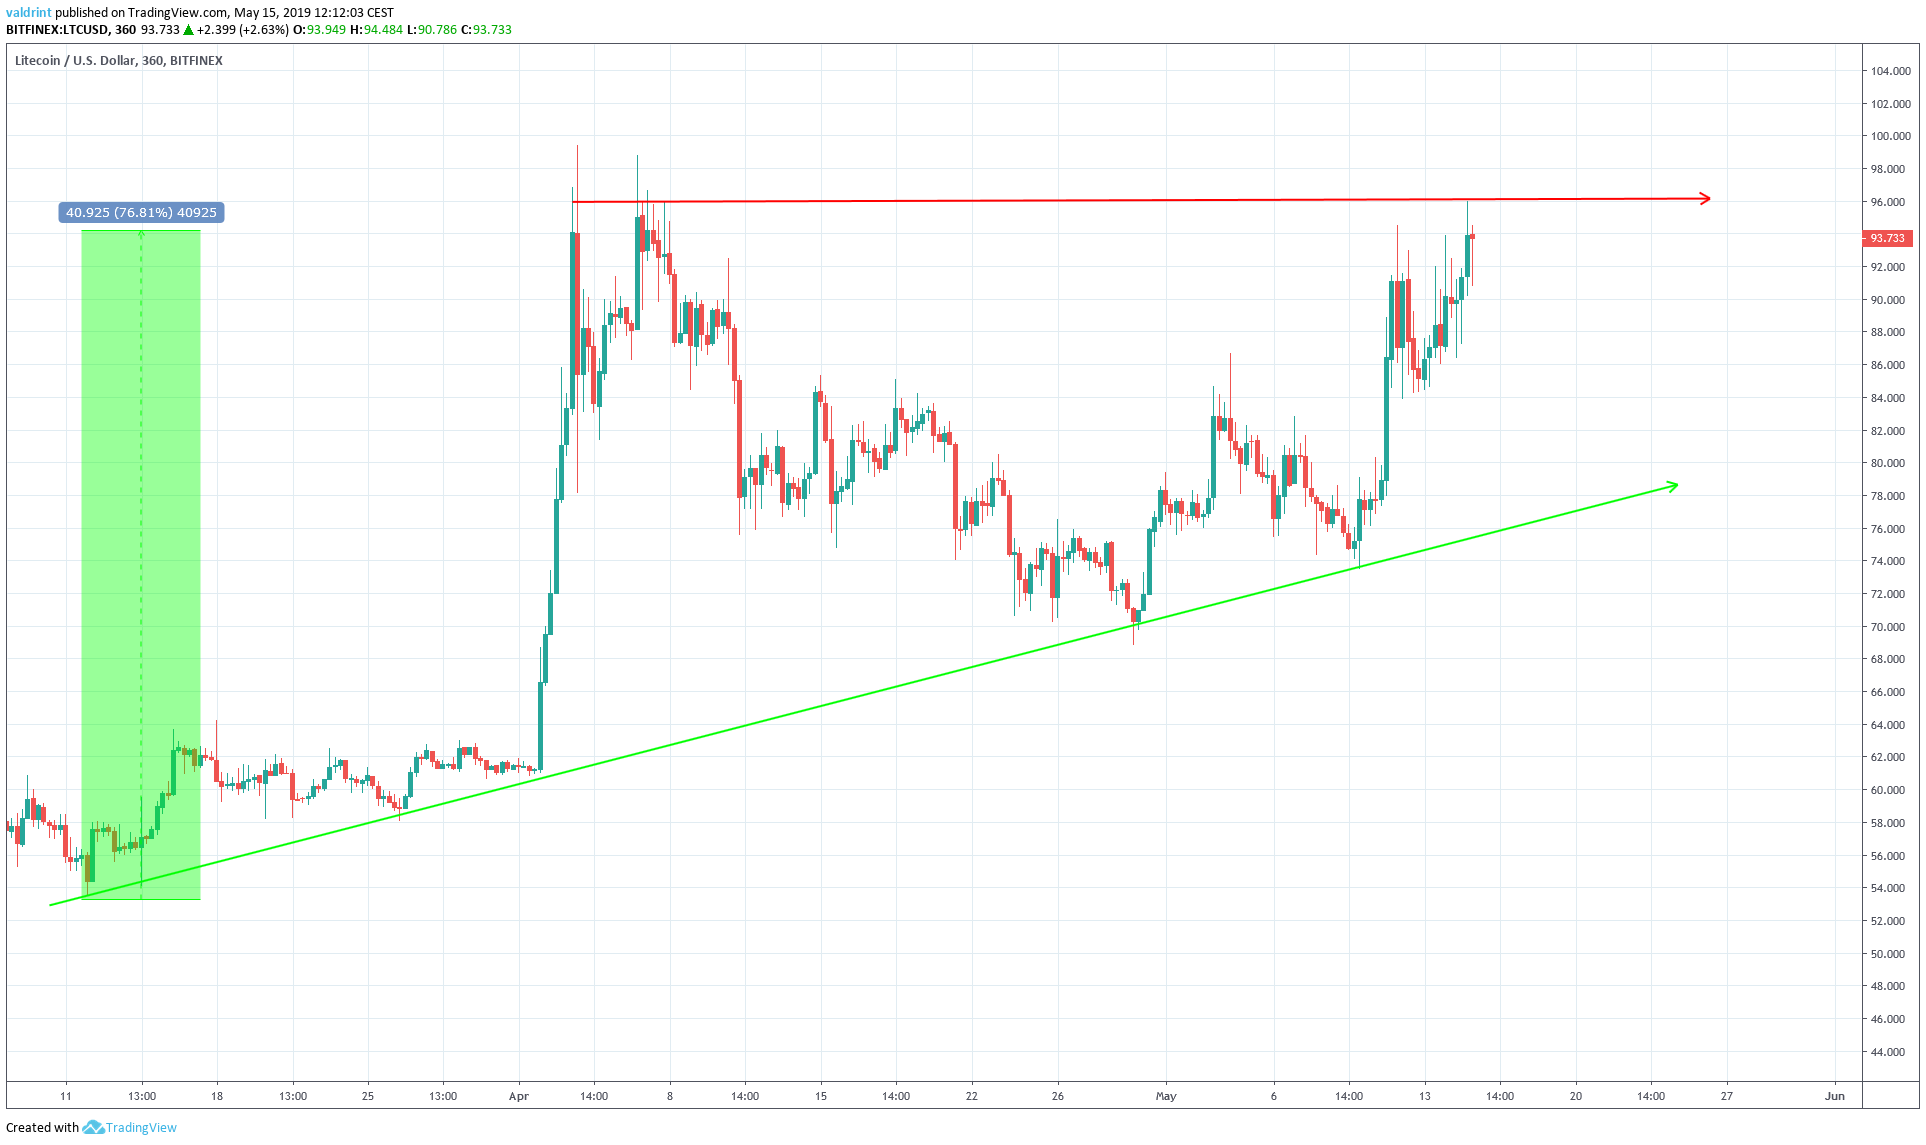
The price is currently trading near $93. Since the beginning of the support line, it has increased by 78%.
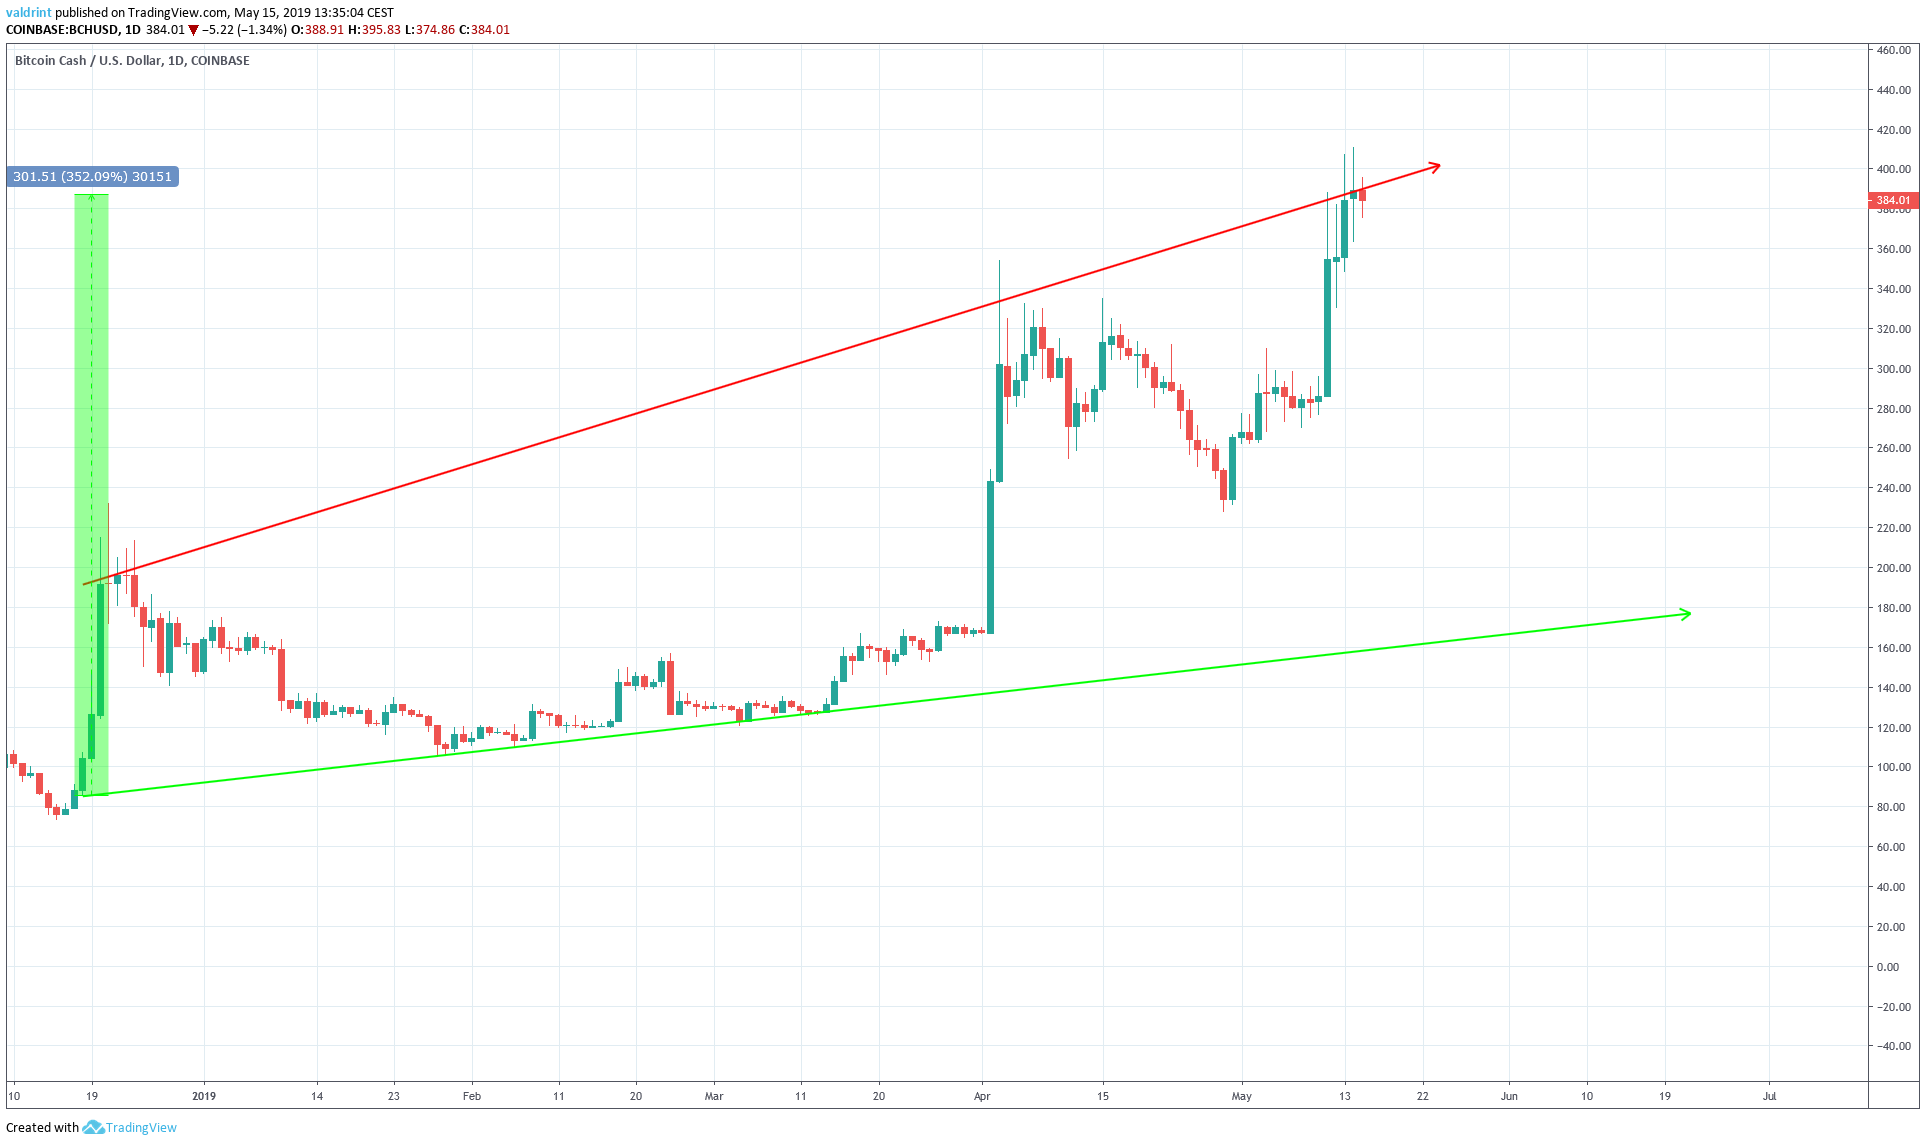
Similar to LTC, the price of BCH/USD has been following an ascending support line since Dec 18, 2018, when a low of $85.2 was reached.
Subsequently, the price surged to reach a high of $232.1 on Dec 21, 2018.
Since then, Bitcoin Cash has been trading along an ascending channel. While trading inside the channel, the price has increased by a massive 352%.
However, these patterns alone are not sufficient to predict future price movements.
In order to do that, we need to take a look at each of these coins within a shorter time-frame alongside relevant technical indicators.
Bitcoin’s Current Pattern
On May 12, the price reached a high of $7448.0. A gradual decrease brought it to a low of $6880.0 the next day. It has been trading inside the ascending channel outlined below:
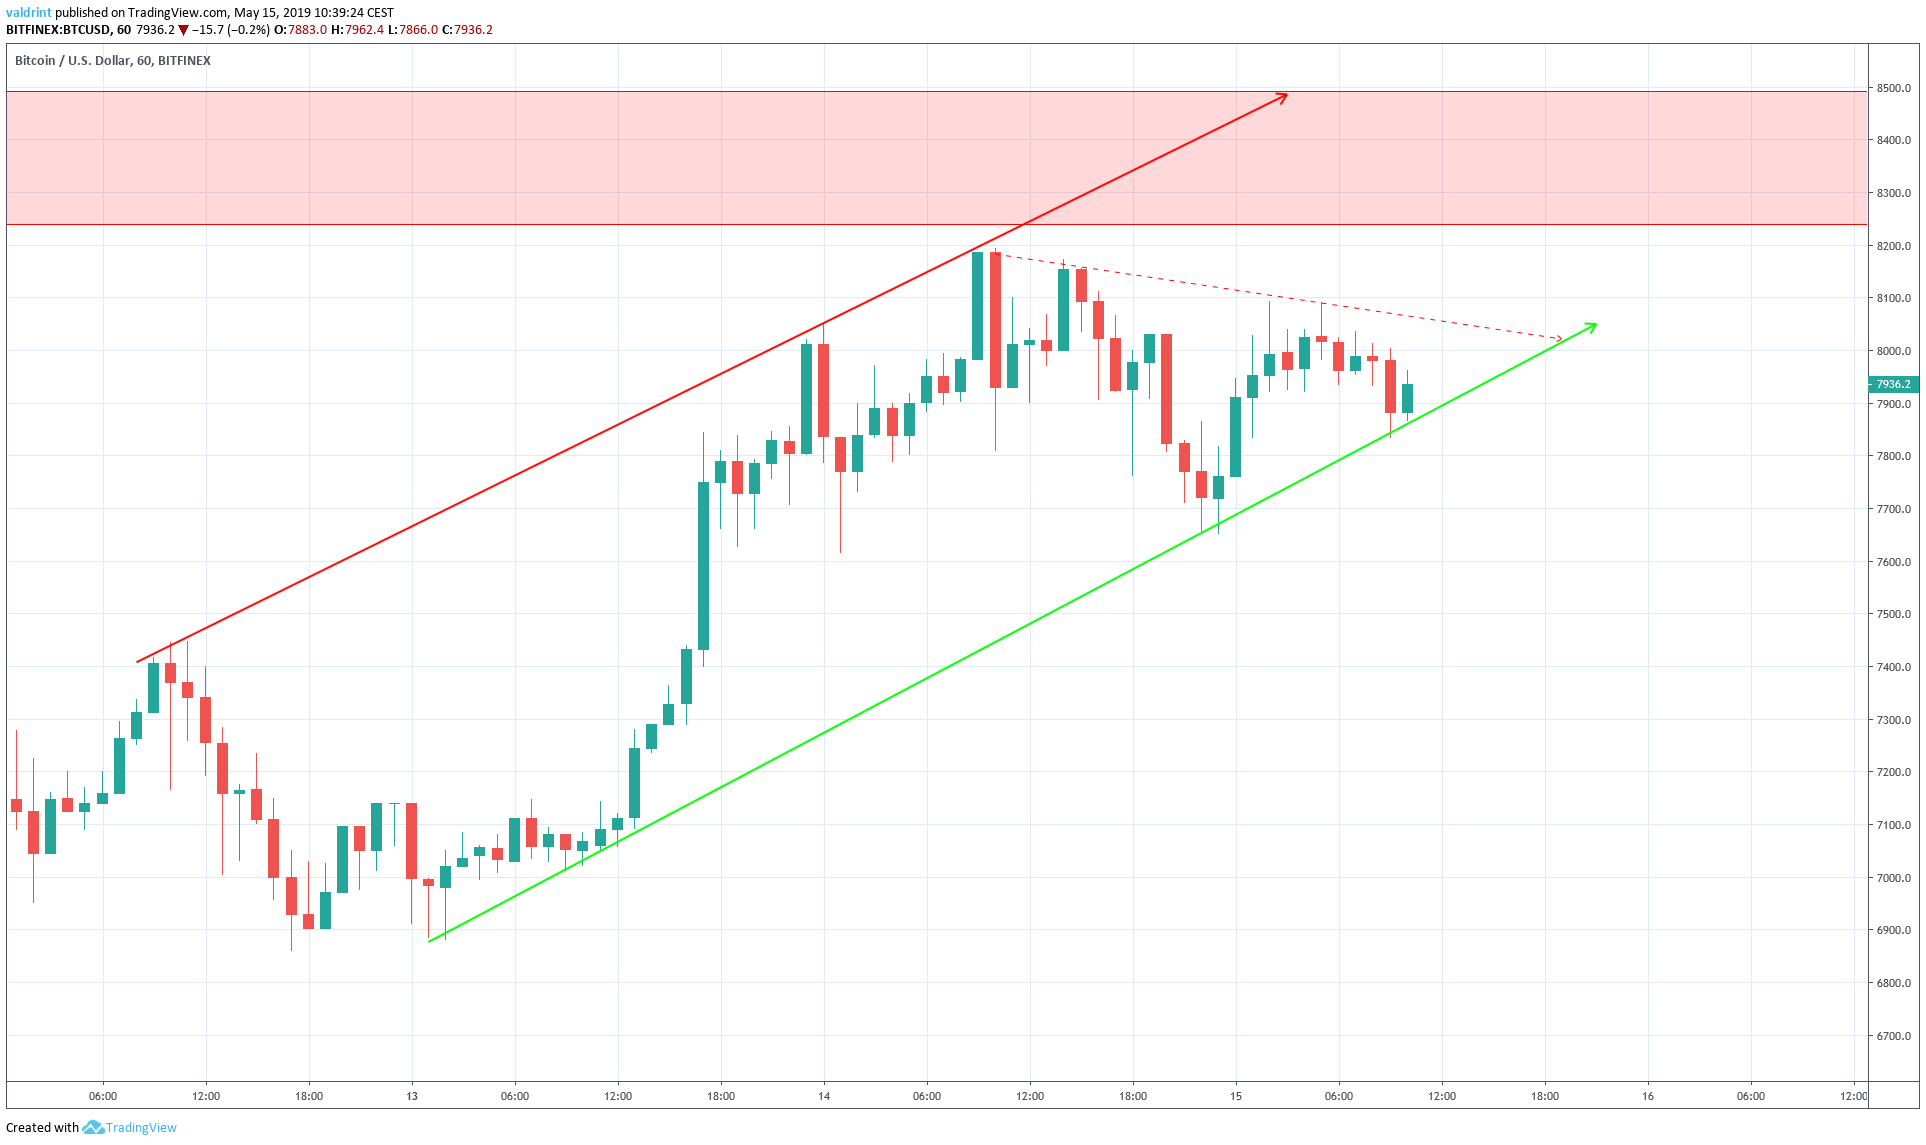
Furthermore, the price seems to be following a short-term resistance line (dashed) which creates a symmetrical triangle.
At the time of writing, the price is trading very close to the support line of the channel.
Will it break down?
In order to figure that out, the price of BTC is analyzed at two-hour intervals alongside the RSI:
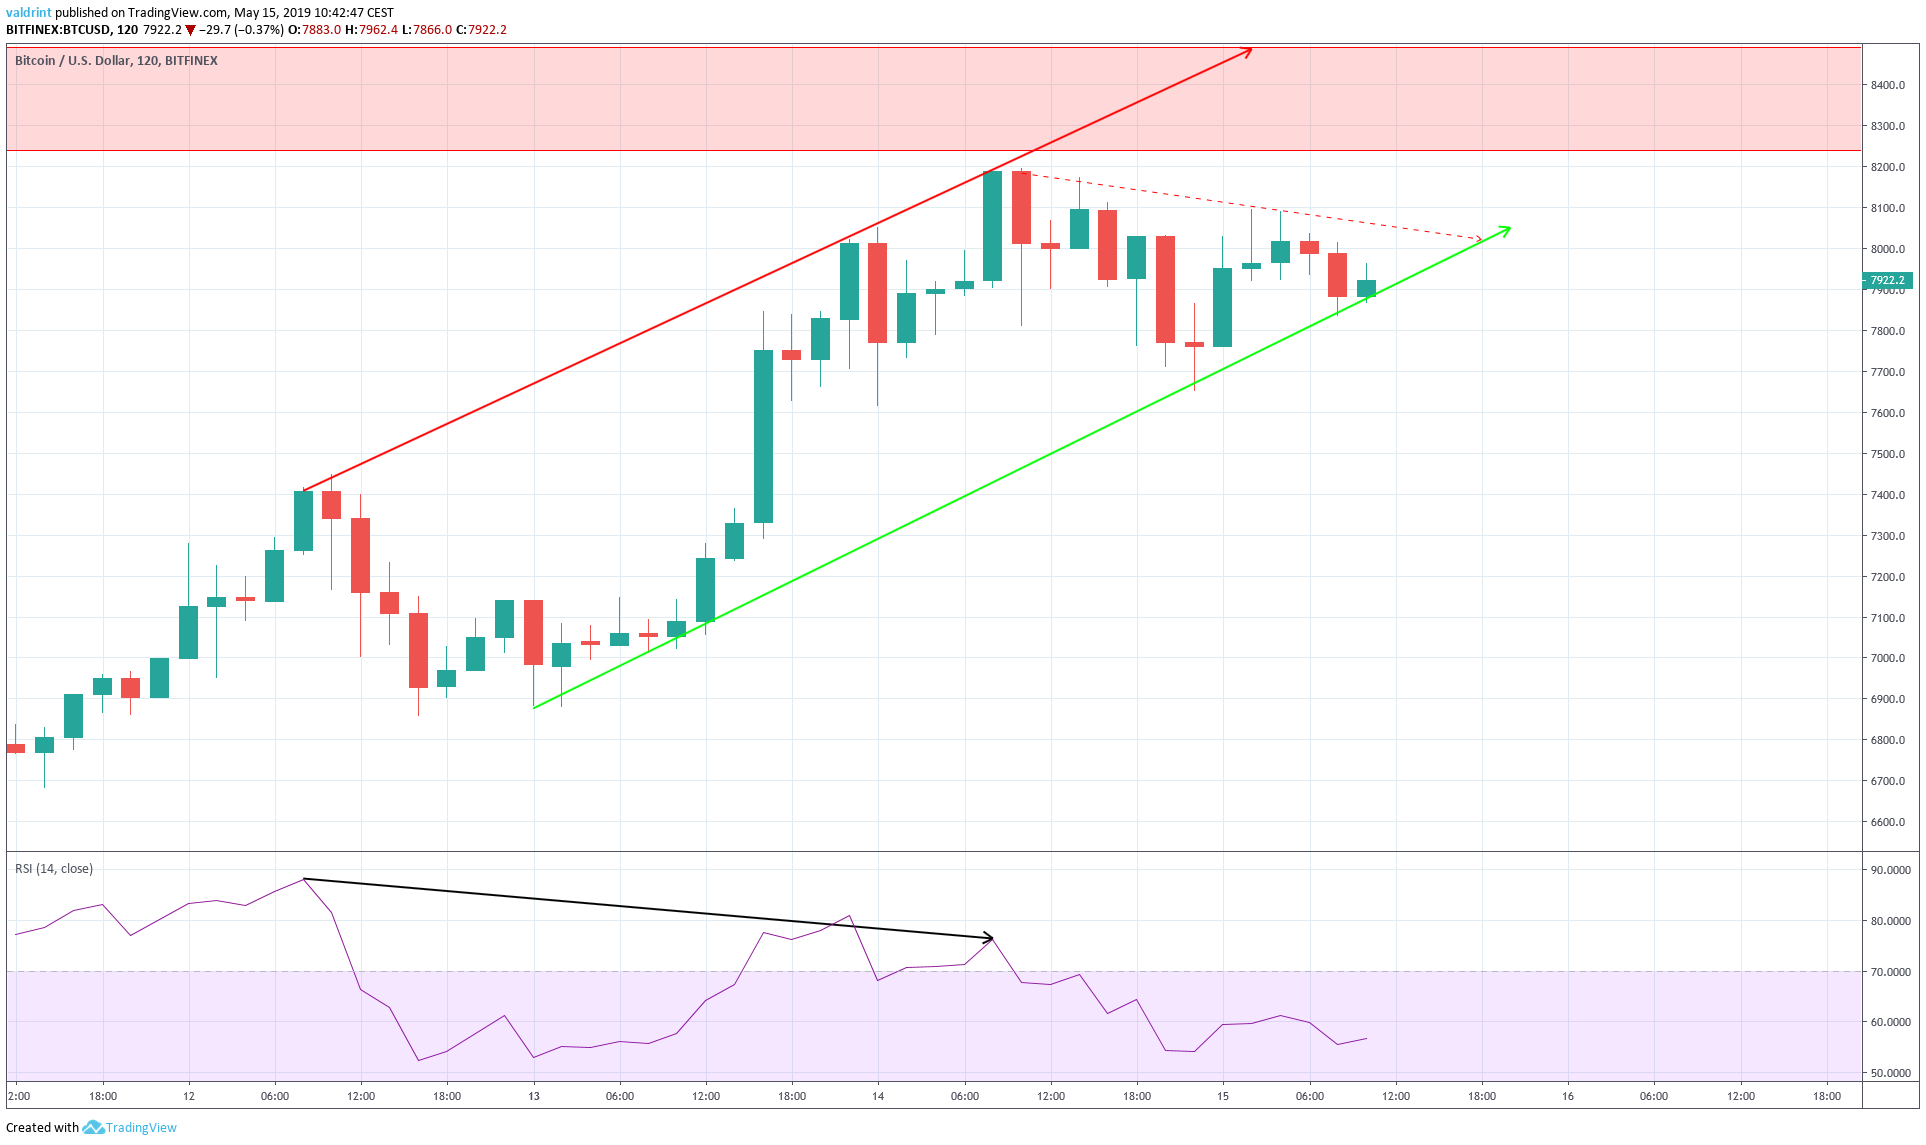
On May 12, the price reached a high of $7448. It continued to increase and on May 14 it reached a high of $8194.1
Similarly, the RSI made the first high on May 12. However, it has continued to generate lower values since. This is known as bearish divergence and often precedes price decreases.
On May 14, the price began a decrease and reached the support line of the channel.
Using these indicators, we are unable to predict whether a breakdown is likely. While we currently believe, it is unlikely that the price will break out above the resistance at $8300-$8500, the sudden and rapid surges lately may prove us wrong.
At the current time, we do not see any profitable trade setups for BTC. If the price reaches the upper limit of our resistance range, we will analyze a possible short setup.
Now, let’s take a look at LTC/USD:
Litecoin’s Triangle
In order to figure out the future movement of the price, we will analyze the price of LTC at six-hour intervals alongside the RSI in the graph below:
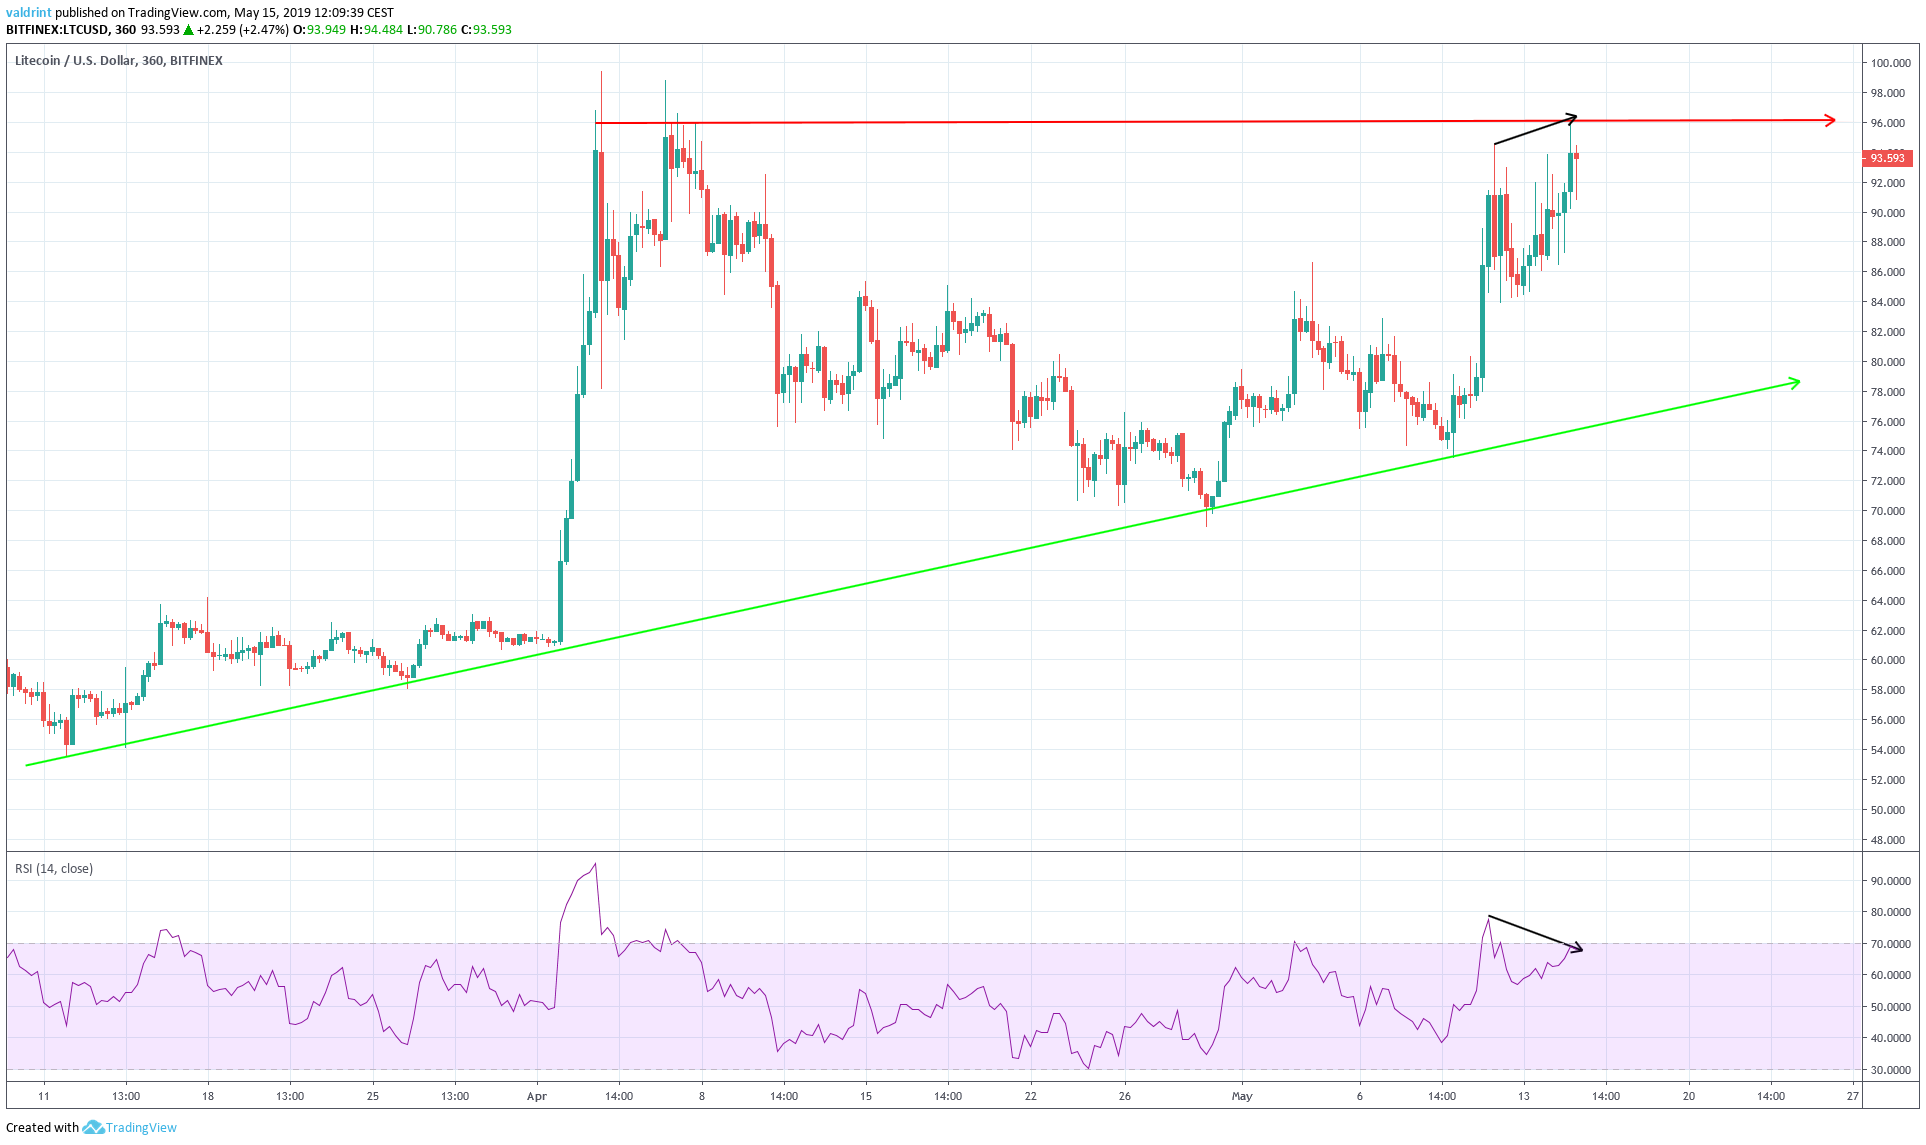
On May 11, the price reached a high of $94.5. It continued to increase and reached a higher high of $96 on May 15.
Similarly, the RSI reached a high on May 11. However, it has proceeded to generate lower values since.
This is known as bearish divergence and often precedes price decreases.
The use of these indicators makes it likely that the price will decrease towards the support line of the triangle.
Since the price is trading very close to the resistance line of the triangle, we will examine a possible short trade setup.
Short Trade Setup
We will examine a possible short trade setup with an average entry of $95.
The stop-loss order is placed at $101, slightly above the Apr 3 high. The value of $101 is also chosen since we believe that $100 can offer psychological resistance. This is a stop loss of roughly 5%.
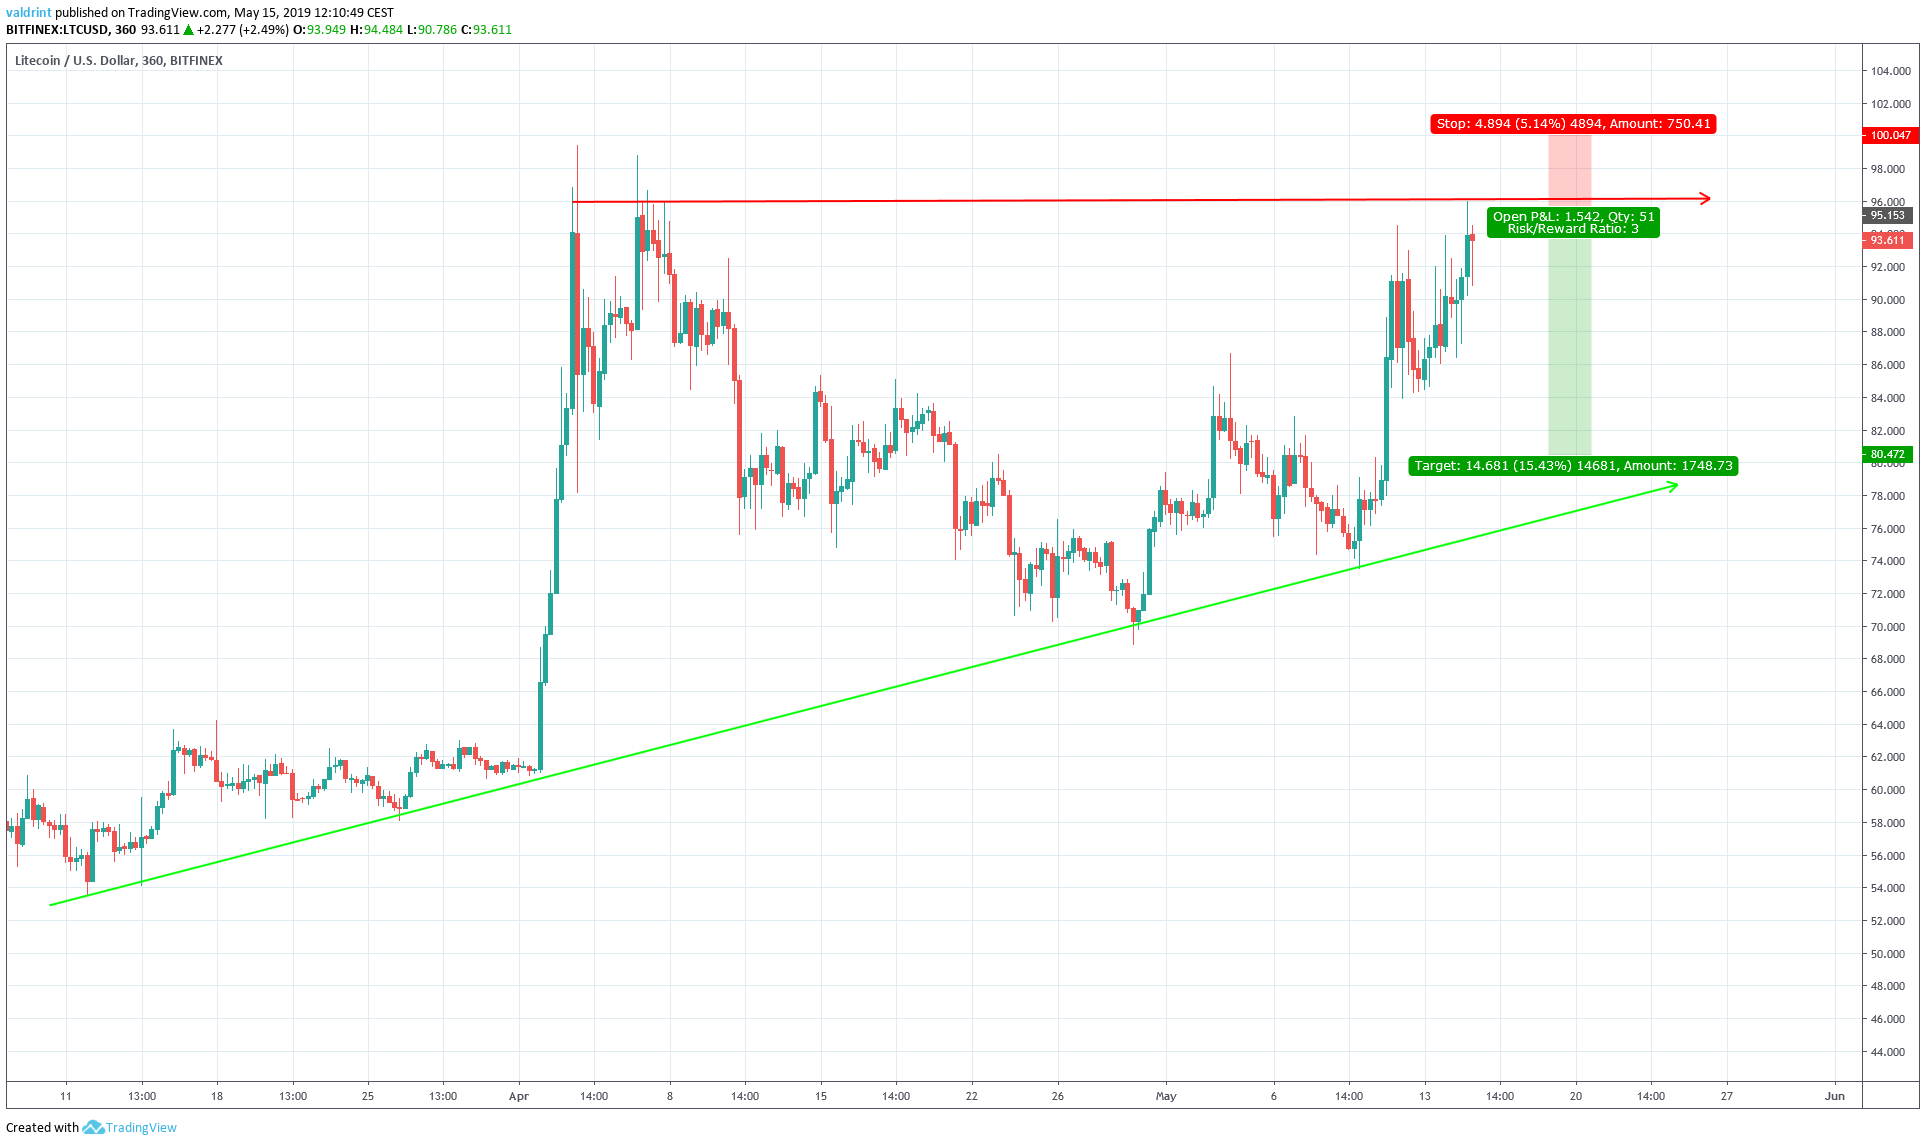
Our target would be $80, slightly above the support line of the triangle.
Combined with the stop loss mentioned above, this is a risk to reward ratio of 3:1.
A breakdown is not needed to reach the target. Rather, only a decrease within the channel is required. Based on our analysis of technical indicators, this is likely.
Furthermore, this is a good entry point for a long-term trade. Until the price reaches our target, we may be able to generate other short-term trade setups. In future analyses, we will attempt to see if this is possible.
Finally, let’s take a look at BCH/USD:
An Ascending Channel For Bitcoin Cash
In the case of BCH, the daily long-term pattern can be used to predict future movement. Therefore, we have outlined the daily price of BCH/USD from Dec 2018 to May 2019 alongside the RSI and the MACD below:
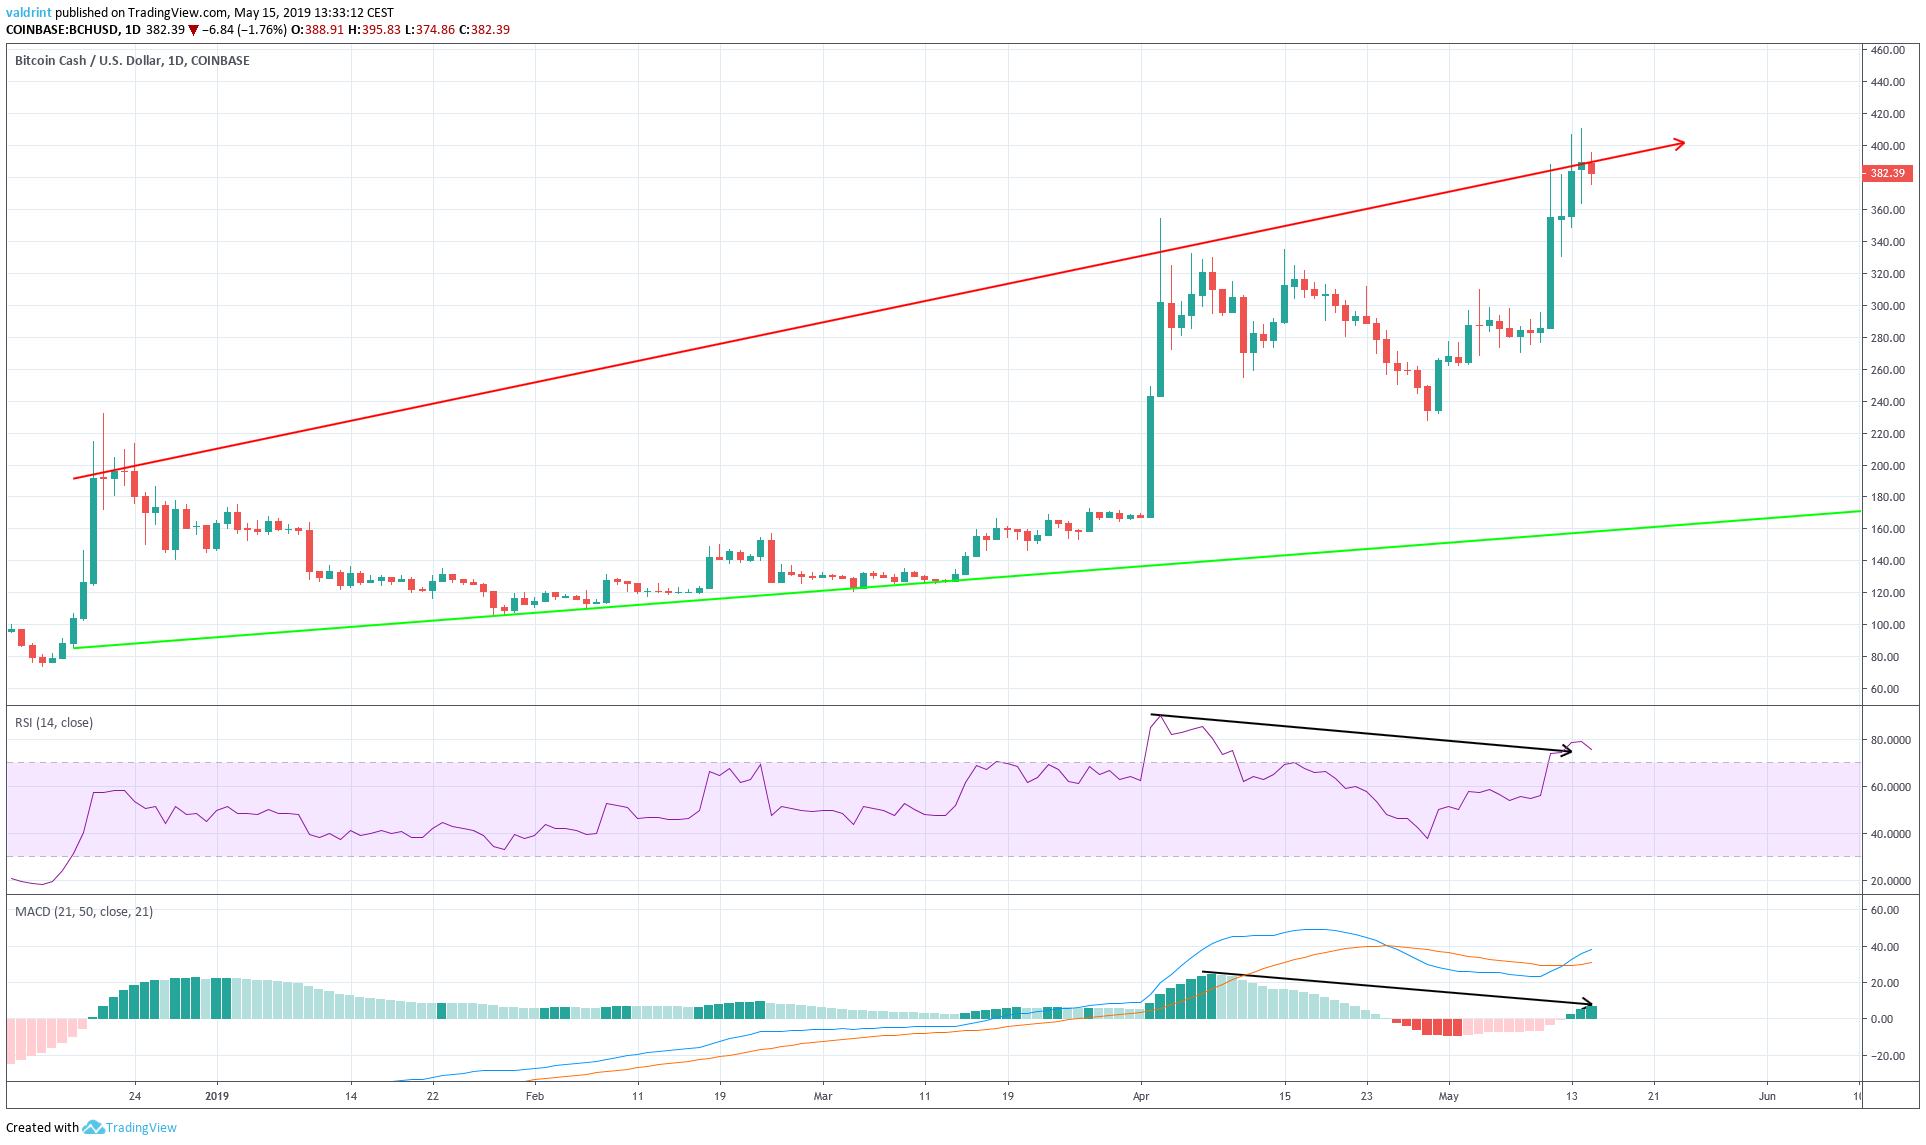
On Apr 3, the price reached a high of $354.27. It continued to increase and reached a higher high of $410.92 on May 14.
Similarly, the RSI and the MACD made a high on Apr 3. However, they have continued to generate lower values since.
This is known as bearish divergence and often precedes price decreases.
The use of these indicators suggests that the price will decrease towards the support line of the channel.
Due to the fact that the price is trading very close to the resistance line of the channel, we will analyze a possible short trade setup below:
Short Trade Setup
We will examine a possible short trade setup with an average entry of $390.
The stop-loss order is placed at $421, slightly above the May 12 high. This is a stop loss of roughly 8%.
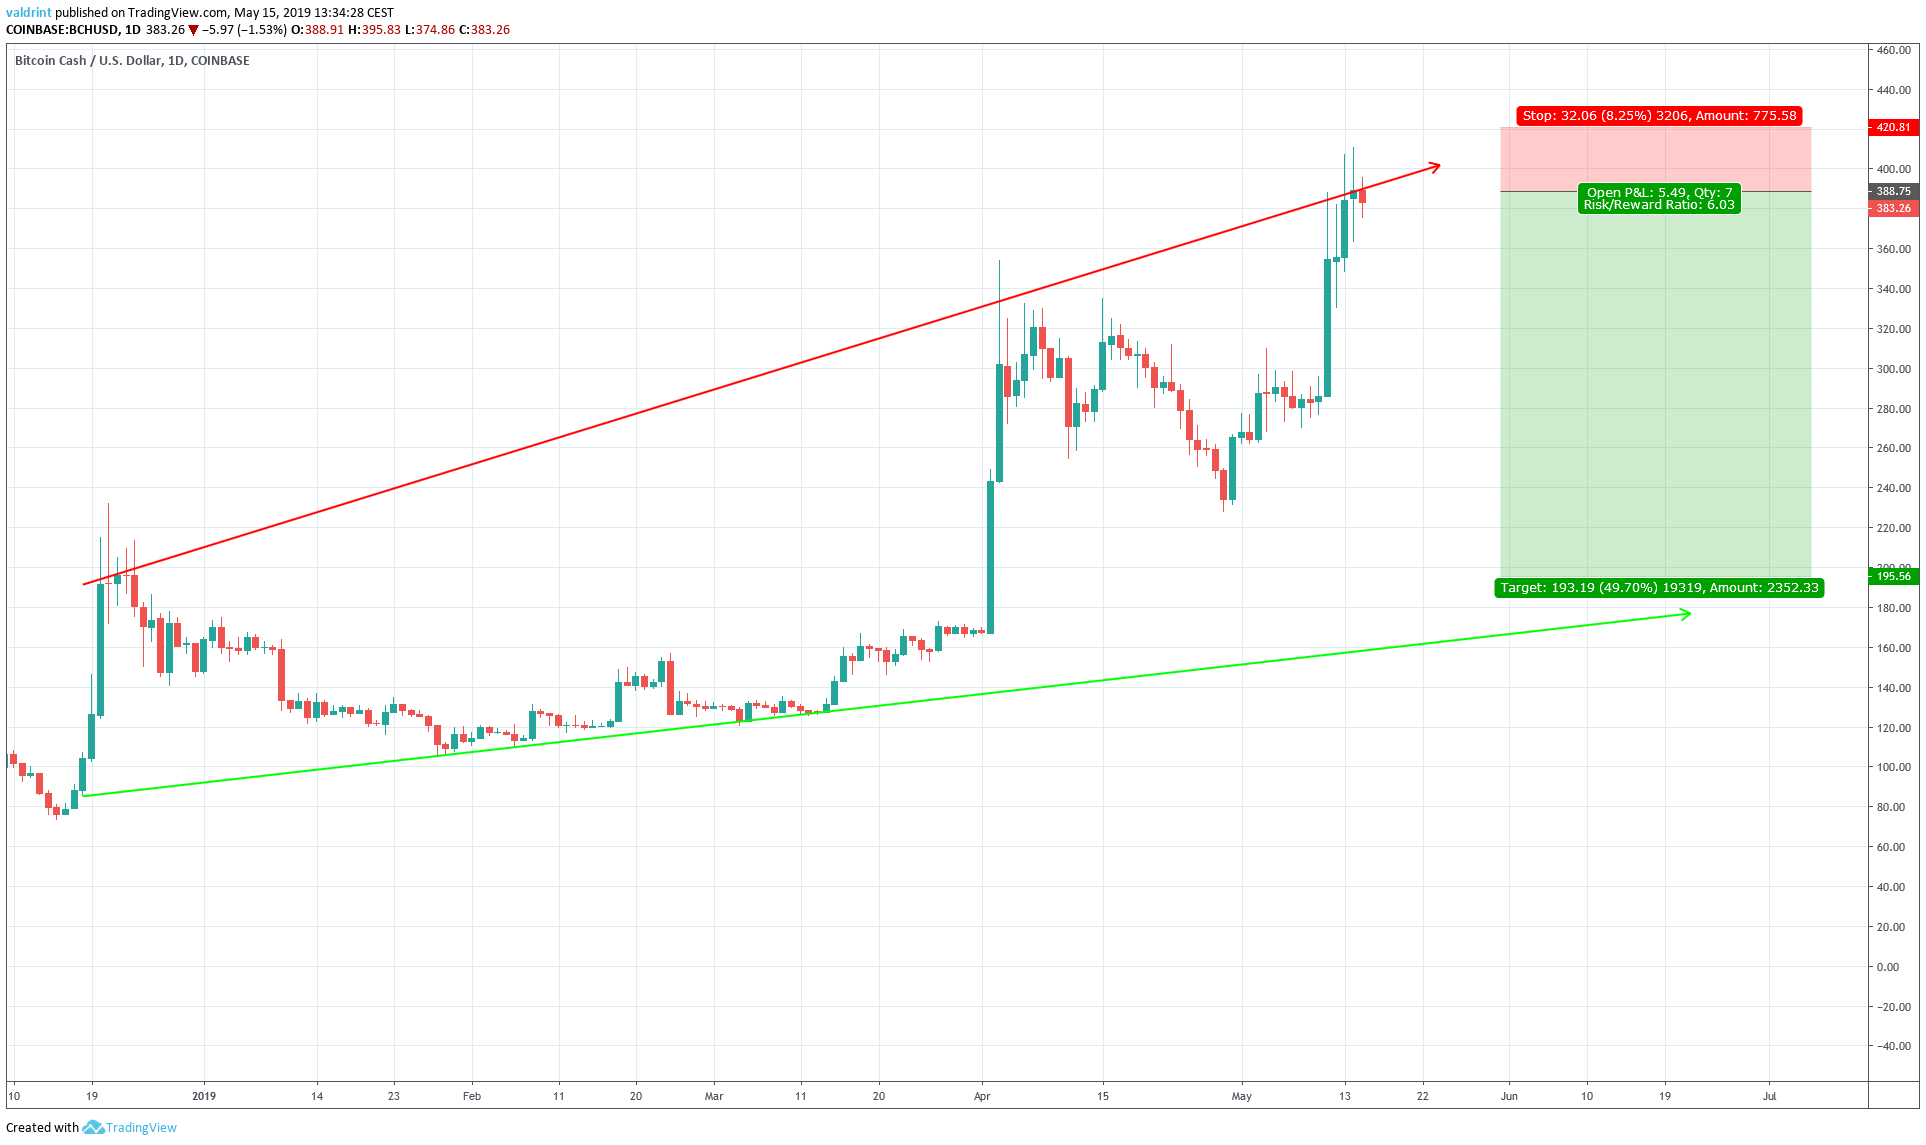
Our target is $195, slightly above the support line of the channel.
Combined with the stop loss mentioned above, this is a risk to reward ratio of 6:1.
A breakdown is not needed to reach the target. Rather, only a decrease within the channel is required. Based on our analysis of technical indicators, this appears likely.
Furthermore, this is a long-term trade setup. We believe other trade setups will present themselves before the price reaches our target.
Conclusion
To conclude, Litecoin and Bitcoin Cash are both following ascending support lines. Litecoin is trading inside a bullish ascending triangle, while BCH is trading inside a neutral ascending channel.
Bitcoin recently broke out of its trading pattern and is not currently following a trading structure, though a new trading pattern may be forming.
Furthermore, both Bitcoin and Bitcoin Cash have developed bearish divergence in long timeframes while Litecoin has only done so in medium timeframes.
To conclude, we believe that Bitcoin faces the best prospects for the near future, due to the fact that it has not generated any bearish divergence and is trading very close to the support line of its pattern.
Conversely, LTC and BCH are trading very close to their respective resistances.
Bitcoin Cash has the most profitable trade setup in place, with a risk to reward ratio of 6:1.
A summary is presented in the table below:

Disclaimer: This article is not trading advice and should not be construed as such. Always consult a trained financial professional before investing in cryptocurrencies, as the market is particularly volatile.