
Bitcoin Technical Analysis | 29 June 2018
Bitcoin (BTC) broke the lower border of the symmetrical triangle on the hourly interval as a result of weak bulls and bear pressure on the currency.
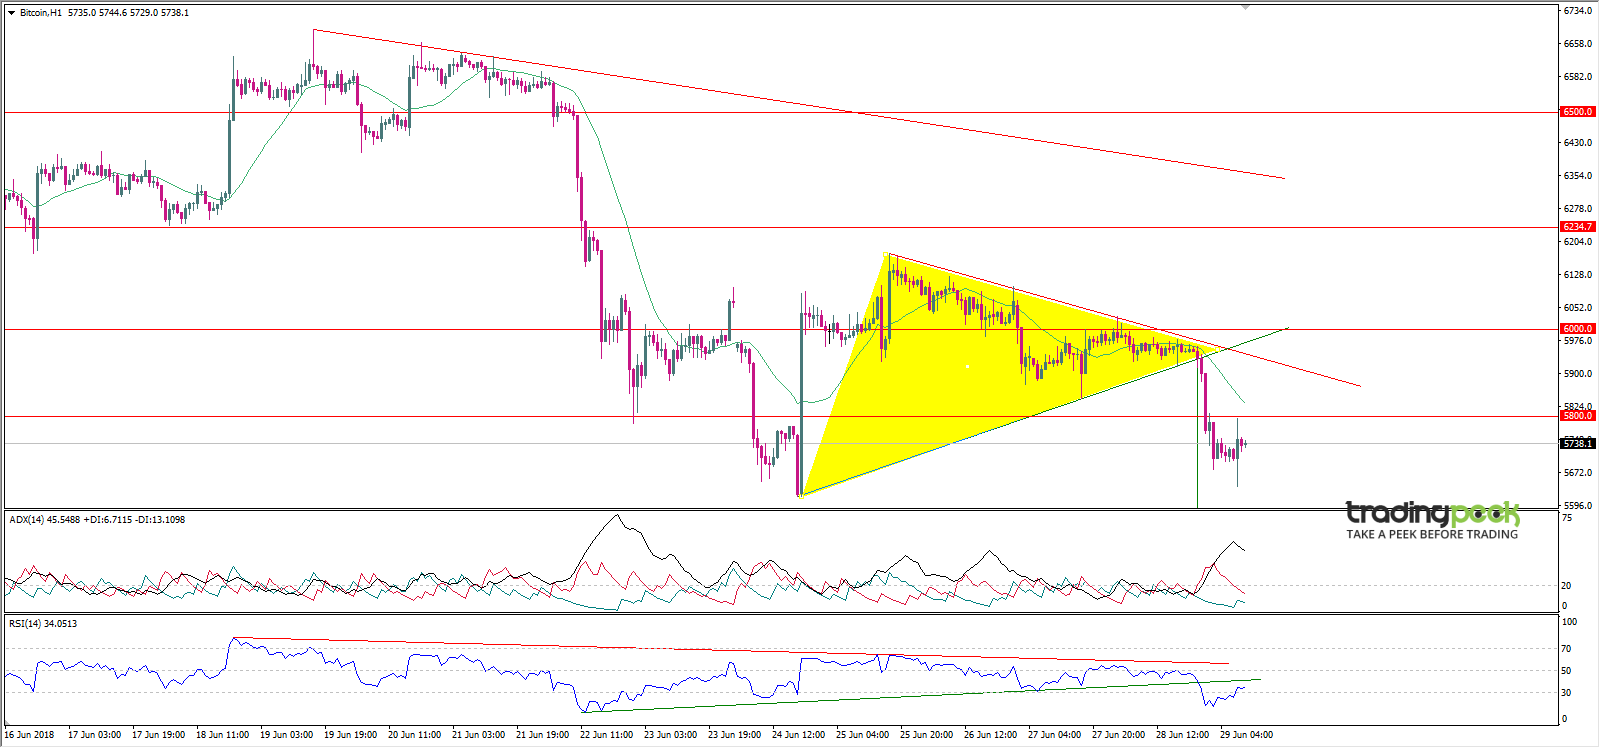
Bitcoin is trading in a bearish direction on the hourly interval, and with the opening of the day, the $ 5800 support area has broken and the currency is currently testing these areas.
The SMA 20 represents a resistance zone now.
Momentum RSI 14 is trading in a bearish direction supported by breaking the bullish trend line that occurred during yesterday's trading.
Outlook:It is expected that, in the case of digital currency breakout, the $ 5640 areas of the region may target $ 5376 targets of the classic model.
On the other hand in the case, a digital currency breakout of the $ 5800 Bitcoin areas may target $ 6,000.
Support: 5500- 5250-5000
Resistance: 5800-6000 - 6234
Trend: Down
Ethereum Technical Analysis | 29 June 2018
Ethereum (ETH) During the morning session, the $ 420.80 low broke as a result of the sellers' pressure on the coded currency, and the decline continued to reach 406.67 areas.
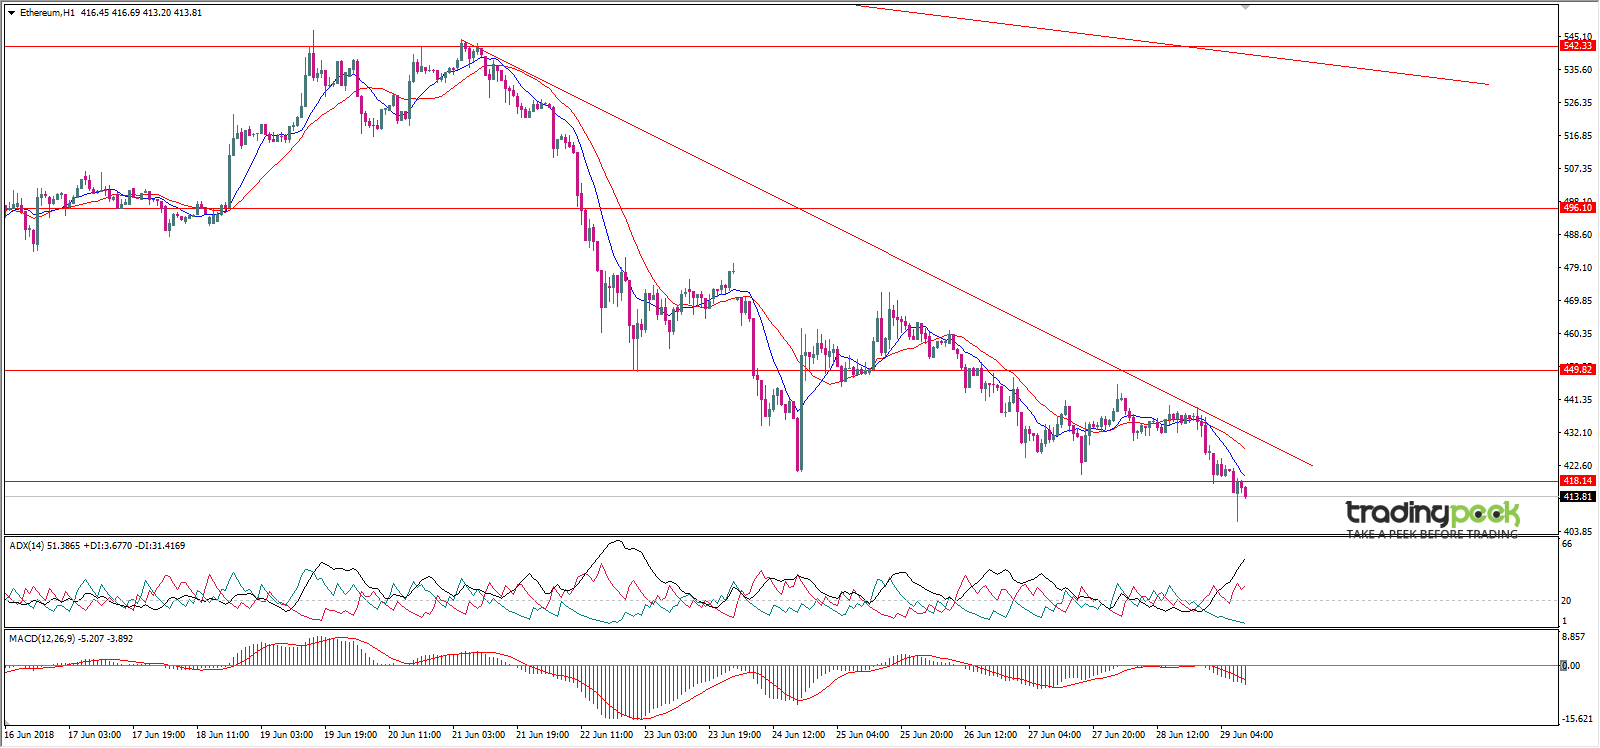
The digital currency is trading in a bearish direction supported by a break of the $ 420.80 area on the hourly interval.
The simple moving average and the slow moving average are pointing downward.
The MACD indicator with regular settings is still bearish.
Outlook:It is expected that, in the case of digital currency penetration of the ethereum zones $ 440.00 may target the currency $ 456.00.
While, in the case of breaking the digital currency ethereum area $ 406.7 may target the area $ 400.00.
Support: 387.47- 360.34- 325.00
Resistance: 418.14- 449.82-496.10
Trend: Down
Ripple Technical Analysis | 29 June 2018
Ripple (XRP) The $ 0.45 area was broken during morning trading due to poor bulls and bear pressure, as well as the failure of the breach of 0.472 during yesterday's trading.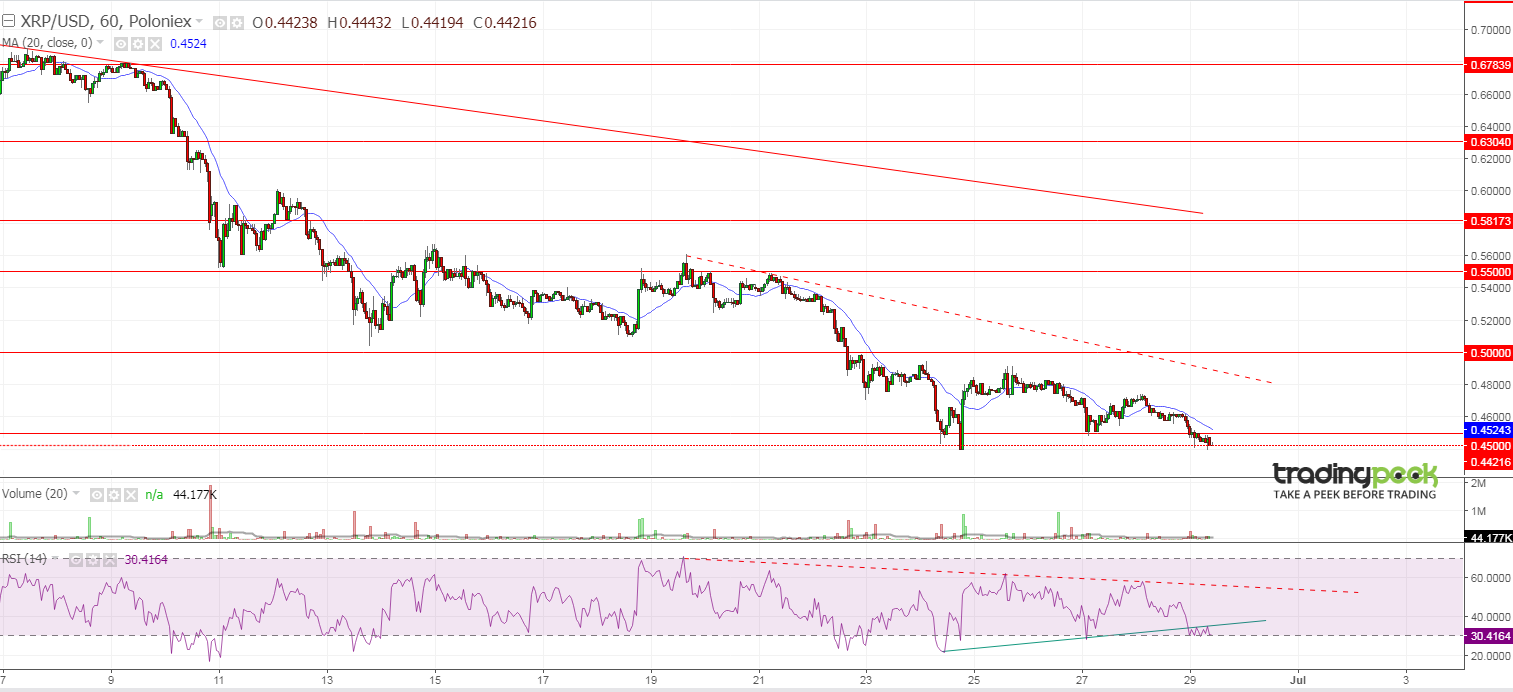
Ripple is trading in a bearish direction supported by a break of $ 0.45 on the hourly interval and we do not recommend opening new positions until the $ 0.44 area is broken.
The SMA 20 represents a resistance zone.
Momentum RSI 14 is trading in a bearish trend in the form supported by breaking the ascending trend line that occurred with yesterday's opening.
Outlook:It is expected that, in the event of a break of the $ 0.44 digital currency, Ripple may target $ 0.4250.
While in the case of a break of the digital currency the Ripple area of 0.4524 might target $ 0.4800
Support: 0.4250- 0.4- 0.35
Resistance: 0.45 0.5- 0.55
Trend: Down
Bitcoin Cash Technical Analysis | 29 June 2018
Bitcoin Cash (BCH) failed to settle above the $ 701.11 zone on the hourly interval so the currency fell towards $ 648.59 zones.
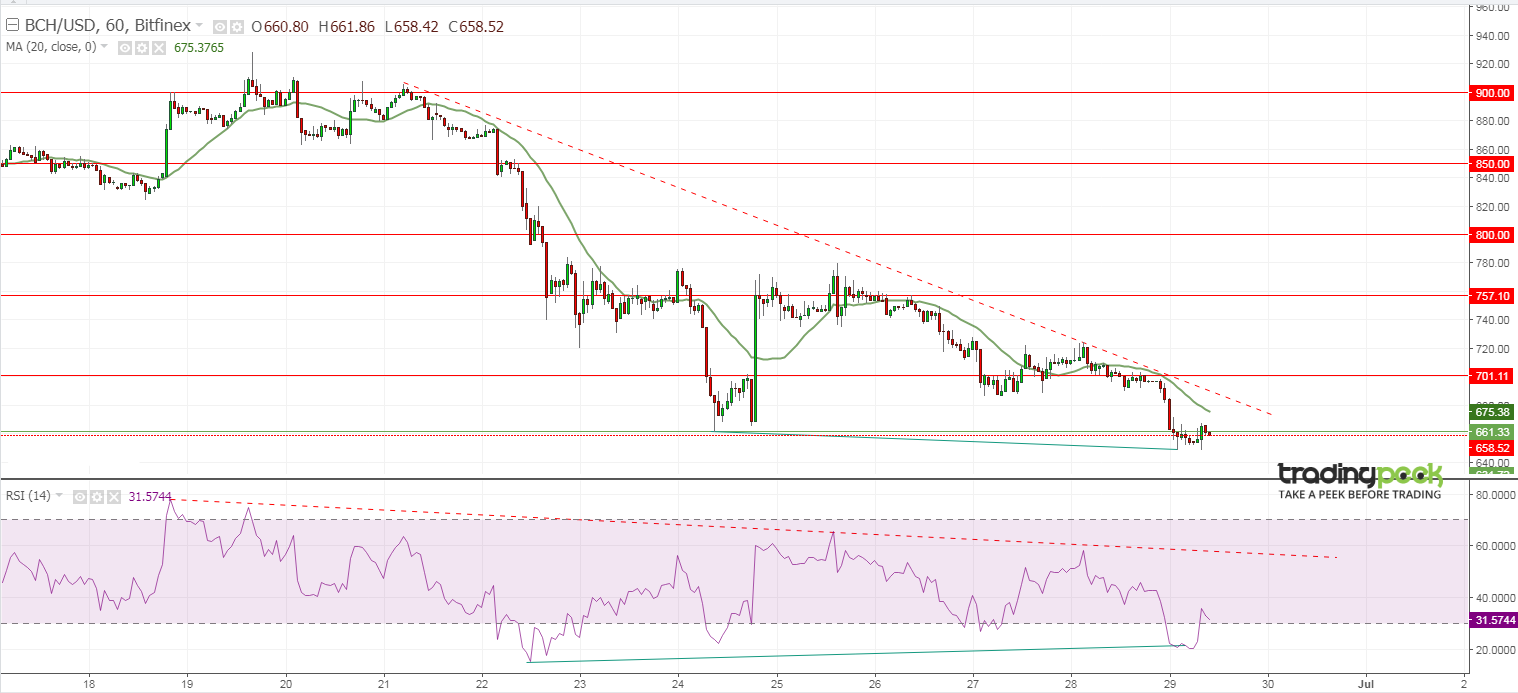
Bitcoin Cash is trading in a downtrend currently under formation supported by a break of the $ 648.59 area on the hourly time frame, and we note the double beginning signs of the bearish trend.
The SMA 20 represents an important resistance area for the coded currency.
Momentum Relative Strength 14 is trading in a bearish trend in the form of weakness due to the closure of the top 30 zone and also due to the emergence of a positive technical deviation in the formation of class A.
Outlook:It is expected that, in the event of a break of the digital currency of the Bitcoin Cash area, US $ 648.59 may target the currency area of $ 600.00.
While, in the case of a breach of the digital currency Bitcoin Cash area $ 688.00 may target the currency $ 711.00.
Support: 661.33-631.72-625.00
Resistance: 701.11 -757.10 - 800.00
Trend: Down