If you were searching for a one-word summary of biotechnology stock performance in September it would be “bloodbath.”
On September 21, biotechs fell 6% following a tweet from presidential candidate Hillary Clinton in support of strict drug pricing legislation. Clinton was responding to the 750% price increase of the HIV drug Daraprim by Turing Pharmaceuticals.
The market continued to sell off through the end of the month, and on October 6, the iShares Nasdaq Biotechnology (O:IBB) produced an ominous death cross.
But since the death cross, IBB has gained 10%.
If you missed the chance to get long biotech then, you’re still in luck, because IBB just found support at a crucial level.
Make Friends With the Trend
As you know, the Fibonacci sequence can be found everywhere in nature – from DNA to the size and shape of entire galaxies. Interestingly, you can also observe this sequence in the stock market.
As a technical trader, I often use Fibonacci retracements to find a stock’s support and resistance levels.
Put simply, these retracements are trend lines based on Fibonacci sequence ratios. Using a recent high and low point, you can determine with stunning accuracy the levels at which a stock will pause as sellers take profits and buyers enter new positions.
The most commonly used Fibonacci ratios are 23.6%, 38.2%, and 61.8%. And while it’s not based on the Fibonacci sequence, the 50% retracement line is often included as a major trend line.
Fibonacci retracements are easy to interpret and can be used on nearly every asset class. You can even use them to trade longs and shorts.
Highway to the Profit Zone
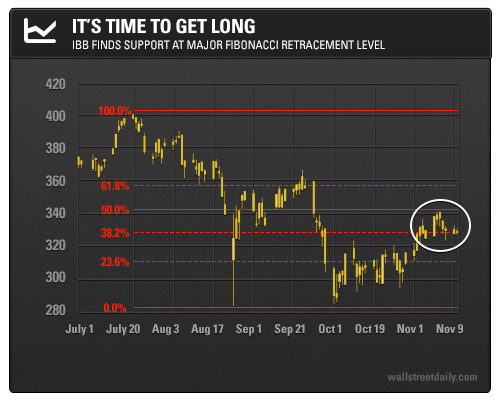
As you’ll recall, IBB has rallied 10% off its recent low and continues to run up the chart. Let’s do a Fibonacci retracement using the 2015 high intraday price at $400.79 and the 2015 intraday low at $284.16.

Since bottoming out on August 24, IBB has marched up the chart, making higher lows along the way. This rising support line is a bullish indicator of relative strength.
As you can see, IBB tested the 23.6% Fibonacci retracement line through most of October and finally broke above the line by month-end.
Last week, shares overshot the 38.2% retracement at $328.71 and then fell back to the line, which has now become support.
Bottom line: If you’re bullish on biotechs, now’s your chance to enter a new position. From there, you can ride shares back to their 2015 high at $398 or hold them for potentially even greater gains.
Remember, if you’re ready to get long a stock, use Fibonacci retracements to spot your perfect entry point. Right now, IBB looks ripe for the picking.
Good investing,
