The broader US index S&P 500 gained 0.72 per cent on Tuesday to a close at 2818 points. The broader index does not show any clear trend on Investtech's medium term graph, but is inside a rising trend channel in the long term, which is one to six quarters.
Since establishing a bottom at 2351 points just before Christmas, the index has risen by almost 20 percent as of date and is just a little shy of its all-time high of 2930 points on closing basis, which does not seem too far and only four percent away from Tuesday's close. Keeping our fingers crossed, if we can say that.
On the charts, the stock price of some of the big Financial Services stocks are doing really well, like Visa Inc (NYSE:V)., PayPal (NASDAQ:PYPL) and Mastercard (NYSE:MA). They are currently trading at their peaks. However, the other big commercial and banking services, investment and asset management stocks like Citigroup (NYSE:C), JP Morgan Chase (NYSE:JPM), Morgan Stanley (NYSE:MS) and Blackrock (NYSE:BLK), to name a few, are not moving in tandem.
As per theory, the stock price cashes in all the available market information and reflects a company's health almost six months in advance. A stock price is nothing but a negotiation between demand and supply that the market players agree to pay for each share traded in the secondary market. So what does the price of a few of these stocks suggest?
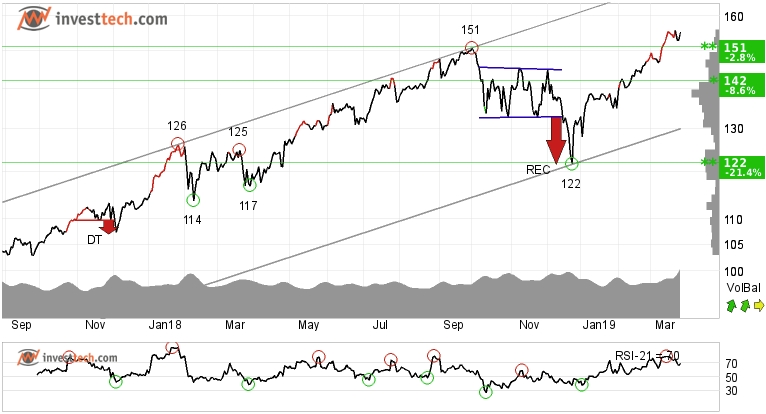
Visa Inc., Close: 155.30
Visa shows strong development within a rising trend channel in the medium to long term. Rising trends indicate that the company experiences positive development and that buy interest among investors is increasing. The stock has broken up through resistance at 151. This predicts a further rise. In case of negative reactions, there will now be support at 151 and 142 dollars.
Positive volume balance indicates that volume is high on days with rising prices and low on days with falling prices, which strengthens the stock. The stock is overall assessed as technically positive for the medium term.
Investtech's outlook (one to six months): Positive
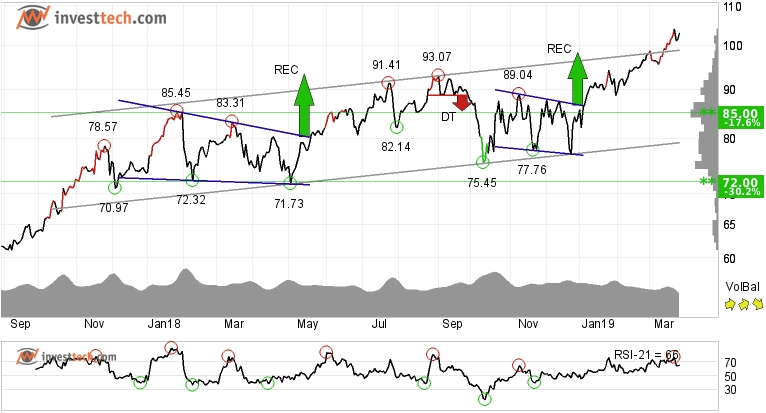
PayPal Holdings (NASDAQ:PYPL)., Close: 103.15
PayPal Holdings has broken up through the ceiling of the rising trend channel in the medium term. Based on the research that we have done in the Scandinavian markets, this kind of breakout signals an even stronger rising rate. This may or may not apply to US stocks.
The price has risen strongly since positive signals from two rectangle formations in the last 15 months. The objective at 98.43 dollars from the last rectangle is now met, but the formation still gives a signal in the same direction. The stock is in all time high, hence it can rise further. However, in case of a downward reaction, there is support between 99 and 90 dollars in the short term. The stock is overall assessed as technically positive for the medium long term.
The positive development, however, may give rise to short term corrections down from today's level. Hence one must maintain proper stoploss as per your preferred time frame.
Investtech's outlook (one to six months): Positive
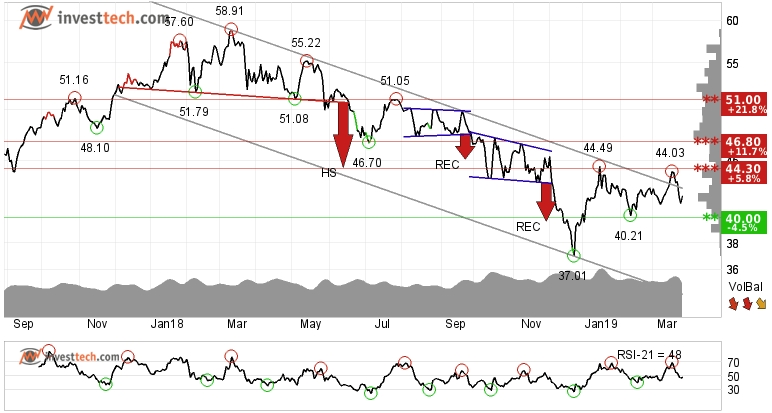
Morgan Stanley (NYSE:MS), Close: 41.88
The Morgan Stanley stock is inside a falling trend channel both in the medium and long term. The stock fell more than 37 per cent in 2018 before making a low in December. In the last three months, the stock has attempted to cross the resistance at 44 dollars, but so far has not been able to sustain above it. To achieve a change in trend, the stock has to make higher tops and higher bottoms and close above the 46.80 mark. Until then it is in a weak zone.
The volume balance indicator is negative, suggesting that sellers are more aggressive with falling prices, while buyers are more passive when the price corrects upwards. There is support around 40 dollars and below that all the way to 37 dollars, which was also the stock's last major low.
Investtech's outlook (one to six months): Weak Negative
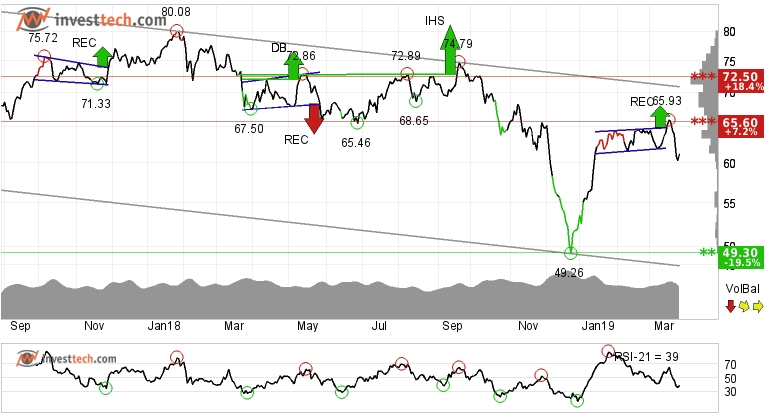
Citigroup (NYSE:C)., Close: 61.22
Citigroup Inc is inside a falling trend channel in the medium term, but unlike Morgan Stanley it is inside an upward trend channel in the long term. Falling trends indicate that the company experiences negative development and falling buy interest among investors.
The stock corrected sharply after making a low of 49.26 dollars, but failed an attempt to move beyond 66 dollars. It has also given a breakdown from a small rectangle formation in the short term. Further downside is anticipated.
The stock is closer to its long term support around 60 dollars. If the price breaks below that, then the support is around 56 and 49 levels. Resistance at 65.60 and 72.50 dollars respectively.
Investtech's outlook (one to six months): Weak Negative
We see that there is mixed behaviour among banking and financial services, investment and asset management stocks. You can study charts and auto-analysis of all such stocks for the short, medium and long term time frames on our website at www.investtech.com
The analyses are based on closing price as per March 26, 2019
Note: These instruments are traded in currency based on the exchange or country they are listed on.
Disclaimer: All analyses used herein are subjective opinions of the author and should not be considered as specific investment advice. Investors/Traders must consider all relevant risk factors including their own personal financial situation before trading.


