
We all look for high dividend payments. I am fixed to get a 3 percent return with good long-term growth perspectives, others like High-Yields with stable payments.
Today I will to show you the highest yielding stocks at the market with positive earnings per shares growth for the next five years. Stocks with yields above the 10 percent mark are very risky and they are likely to reduce their payments in the future. In order to reduce the risks from lower capitalized stocks, I selected only those companies with a market cap above 2 billion.
Only 12 companies fulfilled my mentioned criteria of which five have a current buy or better rating. The results are dominated by real estate trusts. Annaly Capital Management is still on the list but they needed to cut dividends last week by 11.1 percent from 0.45 to 0.4 cts per share. Die interest rate increase hurts the company.
Northern Tier Energy (NTI) has a market capitalization of $2.17 billion. The company employs 2,893 people, generates revenue of $4.653 billion and has a net income of $197.60 million. The firm’s earnings before interest, taxes, depreciation and amortization (EBITDA) amounts to $604.20 million. The EBITDA margin is 12.98 percent (the operating margin is 11.19 percent and the net profit margin 4.25 percent).
Financial Analysis: The total debt represents 24.85 percent of the company’s assets and the total debt in relation to the equity amounts to 58.39 percent. Due to the financial situation, a return on equity of 31.88 percent was realized. Twelve trailing months earnings per share reached a value of $4.78. Last fiscal year, the company paid $1.48 in the form of dividends to shareholders. Earnings of NTI are expected to grow by 47 percent for the next five years.
Market Valuation: Here are the price ratios of the company: The P/E ratio is 4.93, the P/S ratio is 0.50 and the P/B ratio is finally 4.82. The dividend yield amounts to 19.41 percent and the beta ratio is not calculable.
MFA Financial (MFA) has a market capitalization of $2.95 billion. The company employs 37 people, generates revenue of $499.16 million and has a net income of $306.84 million. The firm’s earnings before interest, taxes, depreciation and amortization (EBITDA) amounts to $289.95 million. The EBITDA margin is 58.09 percent (the operating margin is 57.14 percent and the net profit margin 61.47 percent).
Financial Analysis: The total debt represents 70.27 percent of the company’s assets and the total debt in relation to the equity amounts to 286.90 percent. Due to the financial situation, a return on equity of 10.23 percent was realized. Twelve trailing months earnings per share reached a value of $0.81. Last fiscal year, the company paid $0.88 in the form of dividends to shareholders. Earnings of MFA are expected to grow by 4.5 percent for the next five years.
Market Valuation: Here are the price ratios of the company: The P/E ratio is 9.97, the P/S ratio is 6.30 and the P/B ratio is finally 0.94. The dividend yield amounts to 10.10 percent and the beta ratio has a value of 0.31.
VimpelCom (VIP) has a market capitalization of $19.87 billion. The company employs 58,184 people, generates revenue of $23.061 billion and has a net income of $1.982 billion. The firm’s earnings before interest, taxes, depreciation and amortization (EBITDA) amounts to $9,768.00 million. The EBITDA margin is 42.36 percent (the operating margin is 18.09 percent and the net profit margin 8.59 percent).
Financial Analysis: The total debt represents 46.94 percent of the company’s assets and the total debt in relation to the equity amounts to 180.35 percent. Due to the financial situation, a return on equity of 15.17 percent was realized. Twelve trailing months earnings per share reached a value of $1.37. Last fiscal year, the company paid $0.80 in the form of dividends to shareholders. Earnings of VIP are expected to grow by 6.4 percent for the next five years.
Market Valuation: Here are the price ratios of the company: The P/E ratio is 7.07, the P/S ratio is 0.78 and the P/B ratio is finally 1.16. The dividend yield amounts to 6.84 percent and the beta ratio is not calculable.
Oaktree Capital Group (OAK) has a market capitalization of $9.38 billion. The company employs 700 people, generates revenue of $144.98 million and has a net income of $6.672 billion. The firm’s earnings before interest, taxes, depreciation and amortization (EBITDA) amounts to $-638.22 million. The EBITDA margin is -440.21 percent (the operating margin is -445.31 percent and the net profit margin 4,602.21 percent).
Financial Analysis: The total debt represents 2.52 percent of the company’s assets and the total debt in relation to the equity amounts to 361.23 percent. Due to the financial situation, a return on equity of 43.60 percent was realized. Twelve trailing months earnings per share reached a value of $0.97. Last fiscal year, the company paid $2.31 in the form of dividends to shareholders. Earnings of OAK are expected to grow by 11.0 percent for the next five years.
Market Valuation: Here are the price ratios of the company: The P/E ratio is 52.44, the P/S ratio is 56.10 and the P/B ratio is finally 26.26. The dividend yield amounts to 10.54 percent and the beta ratio is not calculable.
Take a closer look at the full list of stocks with very high yields and earnings growth. The average P/E ratio amounts to 16.19 and forward P/E ratio is 9.68. The dividend yield has a value of 13.08 percent. Price to book ratio is 3.13 and price to sales ratio 6.95. The operating margin amounts to 38.23 percent and the beta ratio is 0.59. Stocks from the list have an average debt to equity ratio of 2.91.
Here is the full table with some fundamentals (TTM): 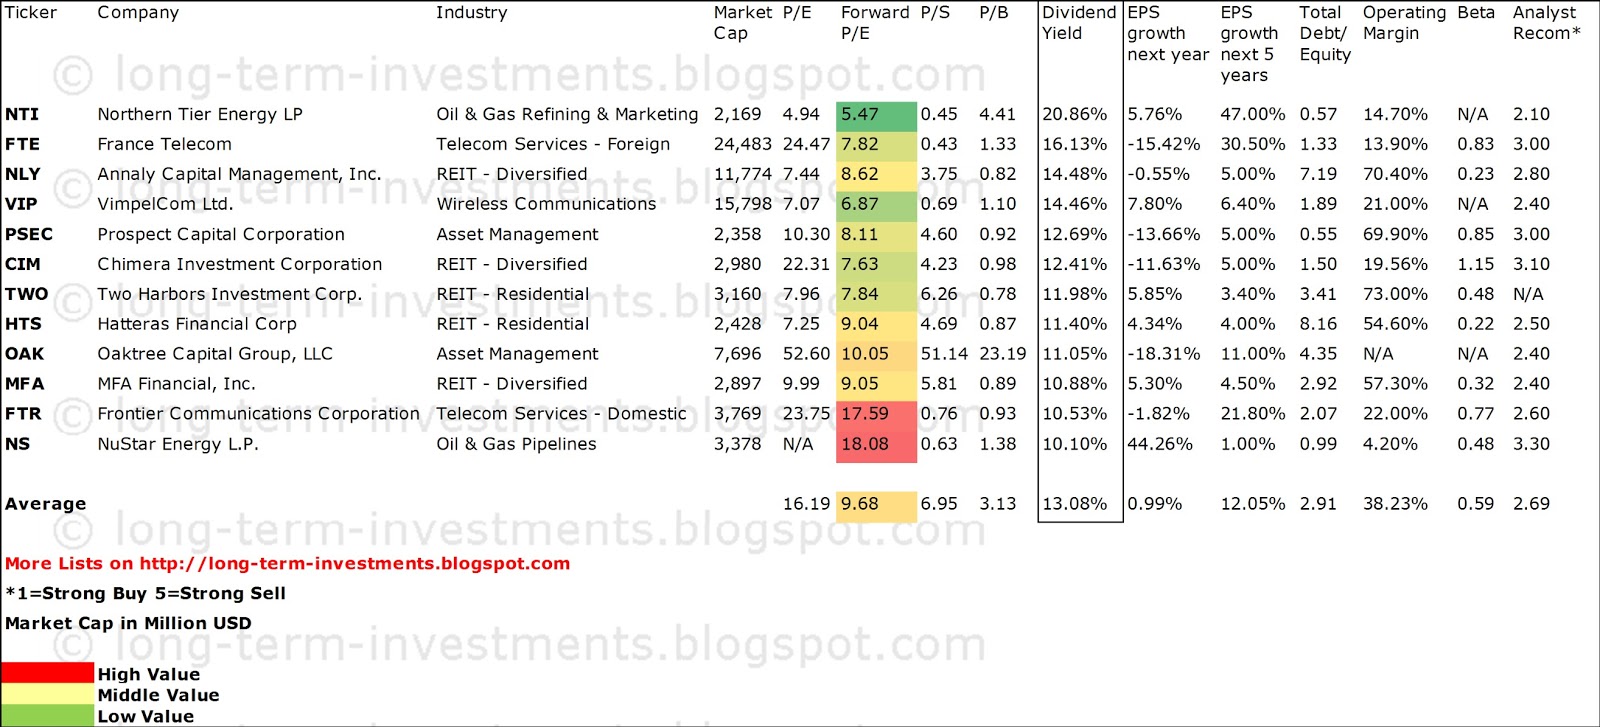
Related stock ticker symbols:
NTI, FTE, NLY, VIP, PSEC, CIM, TWO, HTS, OAK, MFA, FTR, NS
Disclosure: I have no positions in any stocks mentioned, and no plans to initiate any positions within the next 72 hours. I receive no compensation to write about any specific stock, sector or theme.
- English (UK)
- English (India)
- English (Canada)
- English (Australia)
- English (South Africa)
- English (Philippines)
- English (Nigeria)
- Deutsch
- Español (España)
- Español (México)
- Français
- Italiano
- Nederlands
- Português (Portugal)
- Polski
- Português (Brasil)
- Русский
- Türkçe
- العربية
- Ελληνικά
- Svenska
- Suomi
- עברית
- 日本語
- 한국어
- 简体中文
- 繁體中文
- Bahasa Indonesia
- Bahasa Melayu
- ไทย
- Tiếng Việt
- हिंदी
Best Stocks With High Yields, Positive Growth Expectations
Published 06/25/2013, 06:27 AM
Updated 07/09/2023, 06:31 AM
Best Stocks With High Yields, Positive Growth Expectations
3rd party Ad. Not an offer or recommendation by Investing.com. See disclosure here or
remove ads
.
Latest comments
Install Our App
Risk Disclosure: Trading in financial instruments and/or cryptocurrencies involves high risks including the risk of losing some, or all, of your investment amount, and may not be suitable for all investors. Prices of cryptocurrencies are extremely volatile and may be affected by external factors such as financial, regulatory or political events. Trading on margin increases the financial risks.
Before deciding to trade in financial instrument or cryptocurrencies you should be fully informed of the risks and costs associated with trading the financial markets, carefully consider your investment objectives, level of experience, and risk appetite, and seek professional advice where needed.
Fusion Media would like to remind you that the data contained in this website is not necessarily real-time nor accurate. The data and prices on the website are not necessarily provided by any market or exchange, but may be provided by market makers, and so prices may not be accurate and may differ from the actual price at any given market, meaning prices are indicative and not appropriate for trading purposes. Fusion Media and any provider of the data contained in this website will not accept liability for any loss or damage as a result of your trading, or your reliance on the information contained within this website.
It is prohibited to use, store, reproduce, display, modify, transmit or distribute the data contained in this website without the explicit prior written permission of Fusion Media and/or the data provider. All intellectual property rights are reserved by the providers and/or the exchange providing the data contained in this website.
Fusion Media may be compensated by the advertisers that appear on the website, based on your interaction with the advertisements or advertisers.
© 2007-2024 - Fusion Media Limited. All Rights Reserved.