Get 40% Off
🚨 Volatile Markets? Find Hidden Gems for Serious Outperformance
Find Stocks Now

Flextronics: Technical Flexibility

Published 10/14/2015, 02:53 PM
Updated 07/09/2023, 06:31 AM

I like to say that technical analysis is good at showing Point of Reflection, not Points of Inflection. By that I mean it can highlight where changes might occur in a stock price, but not where it will happen. It gives you places to look for opportunities, which you have to be flexible to spot.

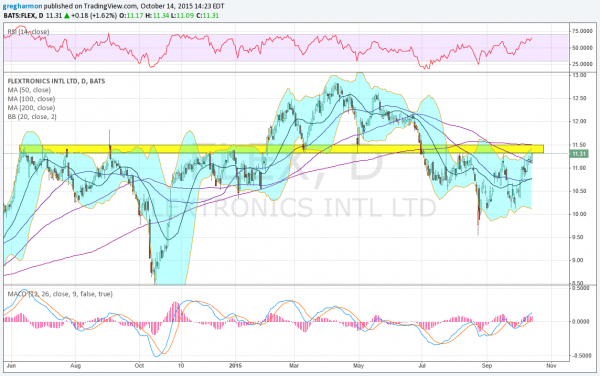
Flextronics International (O:FLEX) is a good example of that. For the past 16 months the stock has moved around a very tight pivot point from 11.30 to 11.50. Ten times the range has stopped the stock trend and reversed it. But twice the price moved through it like that range was not important. The chart below shows that.

Flextronics International

As it approaches the pivot area for the 13th time, it has some real positive momentum. The RSI is making a 6-month high and rising in the bullish zone. The MACD is also rising and making a 6-month high as it, too, turns positive. And the Bollinger Bands® are opening to the upside to allow it to run higher. Will it break through and head toward the previous highs? Or will it get knocked back?

Be flexible as you plan your attack.

Latest comments

Risk Disclosure: Trading in financial instruments and/or cryptocurrencies involves high risks including the risk of losing some, or all, of your investment amount, and may not be suitable for all investors. Prices of cryptocurrencies are extremely volatile and may be affected by external factors such as financial, regulatory or political events. Trading on margin increases the financial risks.
Before deciding to trade in financial instrument or cryptocurrencies you should be fully informed of the risks and costs associated with trading the financial markets, carefully consider your investment objectives, level of experience, and risk appetite, and seek professional advice where needed.
Fusion Media would like to remind you that the data contained in this website is not necessarily real-time nor accurate. The data and prices on the website are not necessarily provided by any market or exchange, but may be provided by market makers, and so prices may not be accurate and may differ from the actual price at any given market, meaning prices are indicative and not appropriate for trading purposes. Fusion Media and any provider of the data contained in this website will not accept liability for any loss or damage as a result of your trading, or your reliance on the information contained within this website.
It is prohibited to use, store, reproduce, display, modify, transmit or distribute the data contained in this website without the explicit prior written permission of Fusion Media and/or the data provider. All intellectual property rights are reserved by the providers and/or the exchange providing the data contained in this website.
Fusion Media may be compensated by the advertisers that appear on the website, based on your interaction with the advertisements or advertisers.
© 2007-2024 - Fusion Media Limited. All Rights Reserved.