
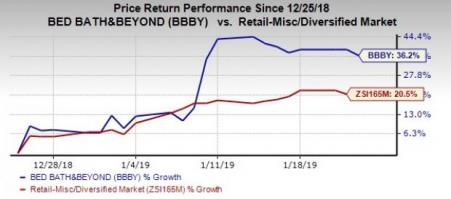
Shares of Bed Bath & Beyond Inc. (NASDAQ:BBBY) have gained 36.2% in the past month, thanks to smooth progress on accomplishing its long-term financial goals. Additionally, the company has a robust earnings surprise trend, having outpaced the estimates in four of the trailing five quarters. Notably, the stock has also outperformed the industry that rallied 20.5% in the same time period.
Bed Bath & Beyond has a Value Score of A and a Zacks Rank #2 (Buy), which further highlights the company’s inherent potential.
Let’s Delve Deeper
Bed Bath & Beyond’s long-term financial targets include moderating operating profit and net earnings per share declines in fiscal 2018 and 2019. Moreover, the company expects to witness net earnings per share growth by fiscal 2020. Management currently estimates earnings of about $2 per share for fiscal 2018. It anticipates earnings for fiscal 2019 to be at the same level as fiscal 2018. In fact, the earnings projection for the next fiscal year exceeded analysts’ expectations.
Moreover, operating margin for fiscal 2019 is expected to match the fiscal 2018’s figure, thanks to the company’s consistent efforts and assessment of all organizational expenses to increase efficiency. However, management continues to project gross margin deleverage for fiscal 2018, mainly due to investments in the customer value proposition and the digital channels. Further, SG&A expenses are estimated to increase on higher investments toward transformational efforts. Furthermore, lower number of store transactions has been hurting its comparable store sales (comps) growth for a while now.
Nevertheless, management expects to witness lower operating margin contraction in fiscal 2018 than in fiscal 2017. In the meantime, Bed Bath & Beyond is in the process of strategically expanding its store count apart from increasing productivity of existing stores to suit customer preferences. In third-quarter fiscal 2018, the company opened four stores and shuttered 15 underperforming outlets. Management targets opening 20 stores, mainly comprising Buybuy BABY and Cost Plus World Markets stores in fiscal 2018.
Simultaneously, it expects to close nearly 40 underperforming stores, including mostly flagship ones to boost profitability. We believe that the store-expansion and productivity initiatives will help the company to boost its comps in the future.
Meanwhile, Bed Bath & Beyond prioritizes its capital needs, making the right investments to help position itself for long-term success. The company incurred capital expenditures of $256 million in the first nine months of fiscal 2018. It anticipates deploying about $350-$400 million for fiscal 2018. Markedly, the company mainly allocates its capital expenditure toward technology projects including digital advancements as well as development of IT infrastructure and new systems; store-expansion endeavors, and other important projects.
Moving ahead, the company expects to allocate more than half of the capital spending on technology-related projects to enhance its omni-channel capabilities. Remaining expenditures will depend on the timing and composition of projects besides investing in other important projects.
Bed Bath & Beyond also bought back shares worth nearly $8 million, reflecting approximately 527,000 shares in the fiscal third quarter. It also declared a quarterly cash dividend of 16 cents per share, payable Apr 16.
Based on the afore-mentioned positives, we believe that Bed Bath & Beyond is well poised for growth in the future, thus offsetting its short-term challenges.
Want More Solid Bets in the Retail Space? Check These
Abercrombie & Fitch Co. (NYSE:ANF) has an impressive long-term earnings growth rate of 15.3%. Also, the company sports a Zacks Rank #1 (Strong Buy). You can see the complete list of today’s Zacks #1 Rank stocks here.
Big 5 Sporting Goods Corporation (NASDAQ:BGFV) is a Zacks Ranked #2 stock that has surged 44.2% in a month.
The Michaels Companies, Inc. (NASDAQ:MIK) delivered average earnings surprise beat of 6.4% in the trailing four quarters. Further, the company carries a Zacks Rank of 2.
More Stock News: This Is Bigger than the iPhone!
It could become the mother of all technological revolutions. Apple (NASDAQ:AAPL) sold a mere 1 billion iPhones in 10 years but a new breakthrough is expected to generate more than 27 billion devices in just 3 years, creating a $1.7 trillion market.
Zacks has just released a Special Report that spotlights this fast-emerging phenomenon and 6 tickers for taking advantage of it. If you don't buy now, you may kick yourself in 2020.
Click here for the 6 trades >>
Abercrombie & Fitch Company (ANF): Get Free Report
Bed Bath & Beyond Inc. (BBBY): Get Free Report
Big 5 Sporting Goods Corporation (BGFV): Free Stock Analysis Report
The Michaels Companies, Inc. (MIK): Free Stock Analysis Report
Original post
Zacks Investment Research