
Bank of Hawaii Corporation (NYSE:BOH) reported a positive earnings surprise of 2.2% in second-quarter 2019, leading to an appreciation of 2.18% in shares, following the release. Earnings per share of $1.40 surpassed the Zacks Consensus Estimate of $1.37. Further, the reported figure compares favorably with $1.30 earned in the prior-year quarter.
Though results were unfavorably impacted by elevated expenses and provisions, investors’ optimism was reflected on growth in revenues. Further, strong capital position along with higher loan and deposit balances were the supporting factors.
The company’s net income came in at $56.9 million, up 4% from the $54.7 million reported in the prior-year quarter.
Revenues Increase, Expenses Escalate, Loans & Deposits Improve
The company’s total revenues increased 4.4% year over year to $170.2 million in the quarter. The revenue figure also beat the Zacks Consensus Estimate of $167.8 million.
The bank’s net interest income was recorded at $124.7 million, up 2.4% year over year. Net interest margin (NIM) remained stable at 3.04%, year on year.
Non-interest income came in at $45.5 million, up 10.2% year over year. This upsurge primarily resulted from rise in almost all components of income, partially mitigated by lower fees, exchange, and other service charges.
The bank’s non-interest expense flared up 2.1% year over year to $92.7 million. This upsurge reflects higher salaries and benefits, occupancy, equipment, as well as data-processing and other expenses.
Efficiency ratio came in at 54.69%, edging down from 56.12% recorded in the comparable quarter last year. Notably, a rise in the efficiency ratio reflects lower profitability.
As of Jun 30, 2019, total loans and leases balances climbed 2% from the end of the prior quarter to $10.8 billion, while total deposits inched up 1.5% to $15.5 billion.
Credit Quality: A Mixed Bag
As of Jun 30, 2019, allowance for loan and lease losses decreased slightly year over year to $107.7 million, while non-performing assets surged 43.4% year over year to $21.8 million.
In addition, the company recorded provision for credit losses of $4 million in the reported quarter, up 14.3% year over year. Further, net charge-offs were $2.4 million or 9 basis points (bps) annualized of total average loans and leases outstanding, up from the $3.3 million or 13 bps recorded in the prior-year quarter.
Strong Capital and Profitability Ratios
Bank of Hawaii was well capitalized with robust profitability ratios during the April-June quarter.
As of Jun 30, 2019, Tier 1 capital ratio was 12.46% compared with 13.27% as of Jun 30, 2018. Total capital ratio was 13.57% compared with 14.47% witnessed in the comparable quarter last year. The ratio of tangible common equity to risk-weighted assets was 12.17% compared with 12.68% at the end of the year-ago quarter.
Return on average assets were up 1 basis point year over year to 1.31%, while return on average shareholders' equity advanced 29 bps to 17.97%.
Capital Deployment
During the second quarter, the company repurchased 433,400 shares of common stock, at an average price of $80.49 and for a total cost of $34.9 million.
Conclusion
Rising loans and deposits aiding revenues remain key positives for Bank of Hawaii. In addition, controlled expenses will likely keep stoking the bank’s bottom-line growth. Furthermore, the company’s profitability ratios indicate solid returns. Nevertheless, elevated provisions are concerns.
Bank of Hawaii Corporation Price, Consensus and EPS Surprise
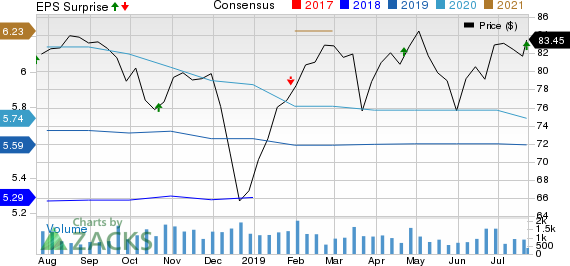
Bank of Hawaii Corporation price-consensus-eps-surprise-chart | Bank of Hawaii Corporation Quote
Currently, Bank of Hawaii carries a Zacks Rank #3 (Hold). You can see the complete list of today’s Zacks #1 Rank (Strong Buy) stocks here.
Performance of Other Banks
Texas Capital Bancshares Inc. (NASDAQ:TCBI) reported earnings per share of $1.50 in second-quarter 2019, lagging the Zacks Consensus Estimate of $1.53. Results, however, compare favorably with the prior-year quarter’s $1.38. Elevated expenses were on the downside. However, rise in revenues was a positive factor. Further, organic growth was reflected, with significant rise in loans and deposit balances.
Driven by top-line strength, Synovus Financial (NYSE:SNV) reported a positive earnings surprise of 1.01% in the June-end period. Adjusted earnings of $1.00 per share beat the Zacks Consensus Estimate of 99 cents. This apart, the reported figure came in 8.4% higher than the prior-year quarter tally. Higher revenues, backed by strong loan balances, stoked organic growth. Notably, lower efficiency ratio and rising fee income were tailwinds. Nonetheless, escalating expenses and provisions were undermining factors.
PNC Financial (NYSE:PNC) reported positive earnings surprise of 1.8% in the second quarter. Earnings per share of $2.88 outpaced the Zacks Consensus Estimate of $2.83. The bottom line also reflected a 5.9% jump from the prior-year quarter’s reported figure. Higher revenues, driven by higher net interest income and escalating fee income, aided the company’s results. However, rise in costs and provisions were headwinds.
Today's Best Stocks from Zacks
Would you like to see the updated picks from our best market-beating strategies? From 2017 through 2018, while the S&P 500 gained +15.8%, five of our screens returned +38.0%, +61.3%, +61.6%, +68.1%, and +98.3%.
This outperformance has not just been a recent phenomenon. From 2000 – 2018, while the S&P averaged +4.8% per year, our top strategies averaged up to +56.2% per year.
See their latest picks free >>
The PNC Financial Services Group, Inc (PNC): Free Stock Analysis Report
Synovus Financial Corp. (SNV): Free Stock Analysis Report
Texas Capital Bancshares, Inc. (TCBI): Free Stock Analysis Report
Bank of Hawaii Corporation (BOH): Free Stock Analysis Report
Original post
Zacks Investment Research