Australia 200 for Wednesday, December 3, 2014
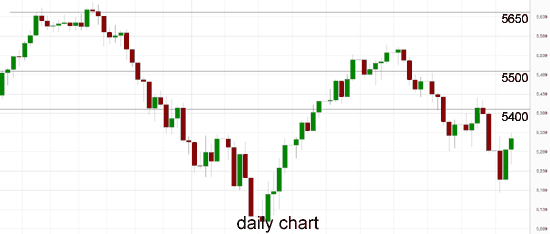
Over the last few weeks the Australia 200 index has returned some of its recent gains falling from above 5550 down to a one month low below 5300 before finding a little support around 5340 and more recently at 5200. Over the last week the index has been struggling with resistance at 5400 and this level remains key as the index has since fallen away back below 5300 again, despite its recent attempts to hold on to the 5400 level. The 5400 level has been a major player all year and the index must get back above this level to encourage more buying and bullish sentiment. Earlier last week the index has been content to consolidate just below the 5400 level. Prior to that it had enjoyed a solid resurgence throughout October after getting much needed support from the 5200 level, which has resulted in it moving back above the 5400 and 5500 levels, around a two month high. Throughout most of September the Australia 200 Index declined strongly from its multi-year high after running into resistance around 5650 back to enter its previously established trading range between 5400 and 5500, before falling further below 5200 and to an eight month low around 5120 a few weeks ago. Several weeks ago it received solid support from the 5100 level which saw it rally well to close out a couple of weeks ago.
Back in early September the 5400 level was called upon to offer support as the index desperately tried to stay in touch with its range, however it fell through there before rallying strongly back up to 5400. Up until recently, the 5400 level had done well and propped up price to keep it within the range. In its recent fall at the beginning of August it moved down to a three week low around 5375, however it received solid support at the 5400 level which has allowed to consolidate and rally higher. The solid move higher throughout July saw it move strongly up through both the 5500 and 5550 levels to reach a then six year high around 5620. In recent weeks it has discovered a new key level to deal with after running into a short term resistance level at 5550, which earlier last week provided some solid support. It reversed strongly several weeks ago bringing it back down to almost touch the 5400 level before rallying back higher again.
At the beginning of June the Australian 200 Index fell and broke back down through the key 5500 level towards a four week low around 5400 before consolidating and resting on support there for an extended period. Back at the end of May, it moved back and forth between the two key levels of 5500 and 5550 before the recent fall. Over the last couple of months the Australia 200 Index has formed an amazing attraction to the key 5500 level as it spent a considerable amount of time trading around it. A couple of weeks ago, the index fell away heavily back down to support around 5400 before returning to the key 5500 level just as quickly, as if gravity had pulled it back. The index has done very well over the last couple of years moving from below 4000 to its present trading levels around 5500.
The RBA kept interest rates at a record low to spur an economy struggling for traction against a high currency and tumbling export prices. Governor Glenn Stevens kept the overnight cash rate target at 2.5 percent for a 16th month, saying in a statement that “key commodity prices have declined significantly in recent months.” Today’s board decision was predicted by all 30 economists surveyed by Bloomberg News and markets had priced almost no chance of a move. “The most prudent course is likely to be a period of stability in interest rates,” Stevens said, repeating comments from last month on rates and the currency. “The Australian dollar remains above most estimates of its fundamental value” and “a lower exchange rate is likely to be needed to achieve balanced growth in the economy,” he said.

Australia 200 December 3 at 01:40 GMT 5322 H: 5339 L: 5256
Australia 200 Technical
| S3 | S2 | S1 | R1 | R2 | R3 |
| 5250 | 5100 | — | 5400 | 5650 | — |
During the hours of the Asian trading session on Wednesday, the Australia 200 Index is rallying well off support around 5200 trying to hang on to the key 5400 level, after falling away from this level last week. For most of this year the Australia 200 Index has moved well from the lower support level at 5000 up to the multi-year highs above 5600 in September.
Further levels in both directions:
• Below: 5250 and 5100.
• Above: 5400 and 5650.
Economic Releases
- 00:30 AU GDP (Q3)
- 09:00 EU Composite PMI (Nov)
- 09:00 EU Services PMI (Nov)
- 09:30 UK CIPS/Markit Services PMI (Nov)
- 10:00 EU GDP (2nd Est.) (Q3)
- 10:00 EU Retail Trade (Oct)
- 12:30 UK UK Autumn Statement
- 13:15 US ADP Employment Survey (Nov)
- 13:30 US Non Farm Productivity (Final) (Q3)
- 13:30 US Unit Labour Costs (Final) (Q3)
- 15:00 CA BoC – Overnight Rate
- 15:00 US ISM Non-Manufacturing (Nov)
- 19:00 US US Federal Reserve releases Beige Book Report
