
Chart 1: HL Ratio has recently fallen but stocks still remain in an uptrend

The strong market recently went through a mini correction, so let us look at the recent market breadth developments. NYSE 52 week new highs and lows data showed a small uptick in new lows throughout the beginning of August, which has pushed the High vs Low Ratio lower, as can be seen in Chart 1.
According to this indicator market breadth is now in neutral territory, neither overbought like it was in middle of July, nor oversold. Mind you, the last time market became extremely oversold was in October 2011 (almost three years ago).
Chart 2: Advance vs decline issues and volume recently became oversold

One of the indicators that did show relatively oversold conditions was the 21 day advance vs declines together with individual up volume vs down volume (please refer to Chart 2). While the extremely oversold zone was not reached, the internals did fall towards 55% on the chart above.
Furthermore, the recent S&P 500 sell off registered 25% of the index at 3 month lows, 10% of the index at 6 month lows and 20% of the index components trading below RSI 30 (oversold). From a short term perspective, one could make a case that a bounce was due; however from a historical data we could hardly call that a wash out or capitulation.
Chart 3: Percentage of stocks above 50 MA became decently oversold
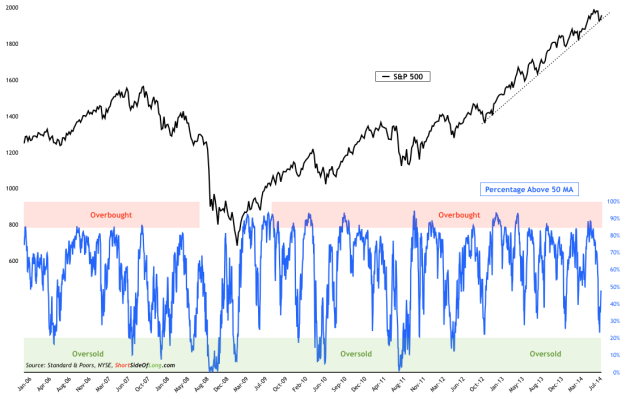
One of the simplest breadth indicators out there is the percentage of stocks trading above a certain moving average. I prefer to focus on the two most used moving averages, 50 day MA for medium term breadth readings and 200 day MA for long term breadth readings.
Chart 3 shows that we became decently oversold into early August, with the indicator falling as low as 23%. This was the lowest breadth reading since November 2012, just as the recent leg of the bull market got underway. As the index remained above its uptrend line and rebounded, we are currently seeing an improvement in breadth readings. It will be very important to see how the rebound plays out as well as how many S&P components follow through on the upside.
It is also just as important to note that while medium term breadth did became oversold, long term breadth has been overbought for quarters on end and is currently sitting in the neutral zone.
Chart 4: Recent correction has so far weakened uptrend participation…

We finish the breadth summary by looking at individual sectors within the S&P 500, as well as their short term, medium term and long term breadth readings. We should be able to observe quite a few characteristics from the table above.
First, the recent sell off has impacted the participation of medium term breadth readings, but not so much the long term. Therefore, a stronger sell off and a lower low will be needed to possibly change the trend.
Second, so far the short term breadth shows that there is a powerful rebound happening. Just about all major sectors, other then Energy and Gold Miners, are participating in a very meaningful way. A quick reversal in these short term numbers could signal a second wave of selling, so keep a close eye on this indicator.
Chart 5: …however Gold Miners participation is highest in three years
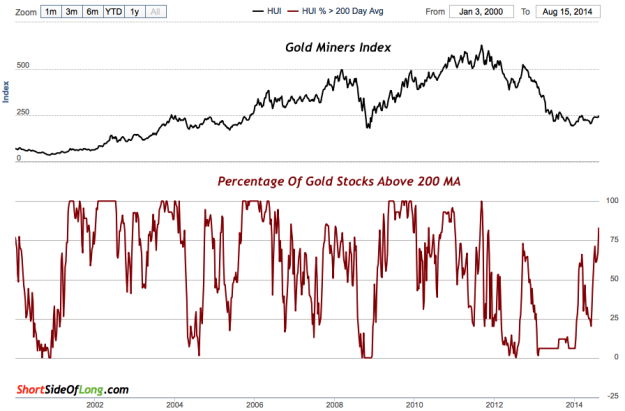
Finally, we focus on the Gold Mining sector. I find it very interesting that 78% of the Gold Mining Index components are now trading above the 200 day moving average. So what does this mean? Well, that is a million dollar question.
Bears would claim that miners are most overbought since late 2011 peak and therefore should be primed for another correction. On the other hand, bulls would claim that miners participation is the strongest in thee years, just as the index attempts to break out from its basing pattern. In my opinion, the wisest thing to do is to sit still and wait for the market to reveal its hand. Be very ware of false breakouts as well.