Is debt inherently bad? Probably not. After all, most homeowners require a mortgage to afford the “American dream.” Indeed, most folks believe that financing real estate is a venerable wealth-building endeavor. They trust property appreciation more than they trust market-based securities like stocks.
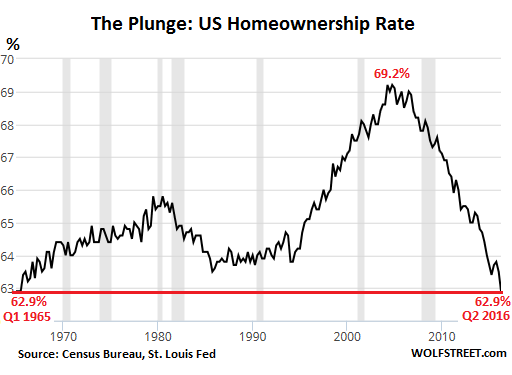
Bear in mind, low mortgage rates in the 5.5%-6.5% range coupled with variable rate loans that were even lower sent property prices surging in the first five years of the 21st century; at the same time, the ownership rate rocketed to the 69% level (2004-2006). Unfortunately, the Great Recession displaced scored of homeowners in the latter half of the decade.
Since 2010, ultra-low mortgages in and around 3.5%-4.5% have boosted real estate speculation once more. What may come as a surprise to economic recovery advocates, however, is that Federal Reserve rate manipulation has reflated property price at the expense of the middle class.
This time around, traditional lenders have been reluctant to provide mortgages to those with insufficient cash flow from wages and/or other resources.
Traditional mortgage lenders currently appear to be diligent in assessment of credit risk. At least on the surface, they seem to be cognizant of the downside in “subprime.”
On the other hand, the federal government may find creative ways to force traditional mortgage lenders to loosen up their underwriting standards. Remember the reemergence of the Community Reinvestment Act’s use in the late 1990s and early 2000s? Government leaders “strongly encouraged” lending to anybody in the name of equality. Common sense on a capacity to repay mortgage debt had been tossed out of the kitchen window.
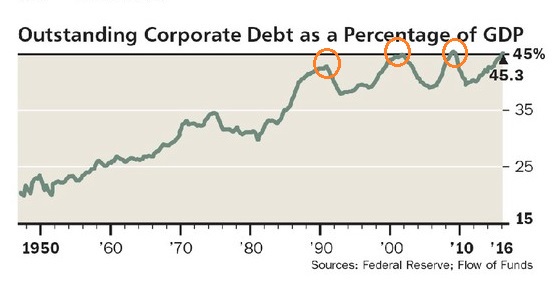
Today, it may not be subprime borrowing households at issue. Subprime borrowing corporations have already gained too much access to other people’s money. Indeed, the last three times that the leverage ratio “corporate-debt-to-GDP” rose to these heights, a recession arrived shortly thereafter.
If a corporation cannot pay back what it has borrowed, or at least be certain of an ability to service interest obligations indefinitely, the decision to borrow would be reckless. Nevertheless, investors are scooping up yield without regard for the risk of loss.
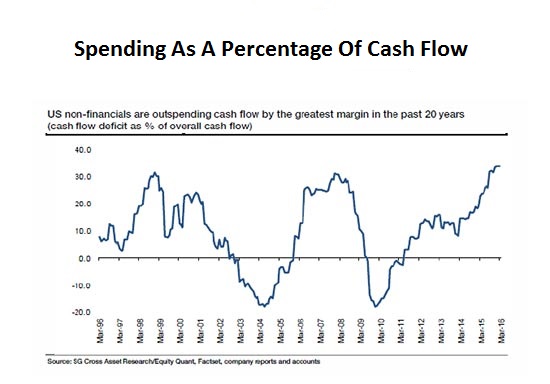
Meanwhile, few analysts show genuine concern about the borrowing binge. They should. U.S. companies spend 35% more than operating cash flow – the highest cash flow deficit in 20-plus years of data. Companies do so by issuing more and more bonds to the yield-starved investing community.
The average credit rating on U.S. corporate debt? Junk. In fact, three quarter’s of corporations have experienced a junk-level rating of single-B.
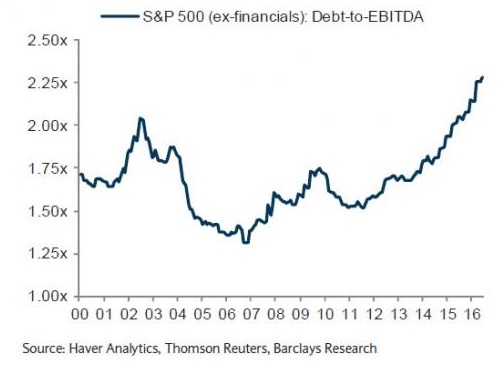
It gets worse. The leverage ratio, “debt-to-EBITDA,” demonstrates that it would take the typical S&P 500 company more than two and one-quarter years to pay back its obligations. Corporations have not been this over-leveraged on this measure in the 21st century.
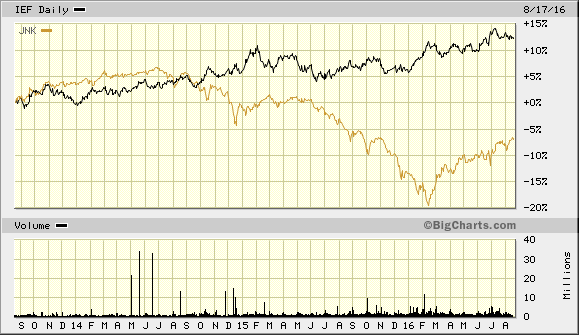
In truth, investors in corporate bonds have stopped asking whether a company generates sufficient cash flow or earnings; rather, many have fallen into a complacency trap, as a 6% yield in SPDR High Yield Corporate (NYSE:JNK) appears to beat the heck out of 1.5% yield in comparable treasuries. (Note: The total return over the last three years for iShares 7-10 Year Treasury (NYSE:IEF) has outperformed SPDR High Yield Corporate (JNK) with a lot less volatility).
Had companies spent the money on productive assets like equipment or buildings – had they invested more in human resources and business expansion – the corporate debt binge might be less worrisome.
Unfortunately, the vast majority of those dollars were spent on shareholder dividends, stock buybacks and inorganic growth via mergers/acquisitions. Companies have spent very little on their long-term growth.
Put another way, total corporate debt has climbed 61% over the last five years. Has it led to a boom in sales revenue? Quite the opposite. Corporate sales peaked over four years ago in mid-2012.
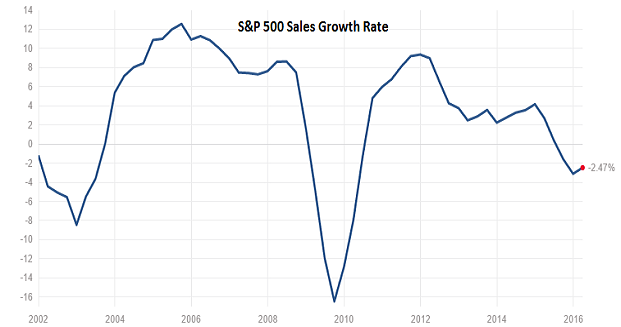
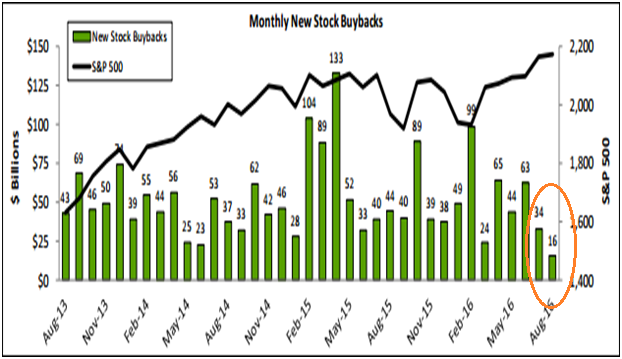
So why on earth do stocks remain near all-time highs? When companies post declining sales as well as declining earnings for five consecutive quarters? For one thing, corporate share buybacks have reduced the total supply of stock shares in existence. Less supply a la scarcity boosts stock prices.
What’s more, central banks around the globe have depressed inflation-adjusted rates into negative territory, persuading many that there are no alternatives to stocks. Stable demand in conjunction with reduced supply helps anchor benchmarks like the S&P 500, regardless of deteriorating fundamentals.
On the flip side, the most recent data for stock buyback announcements sits at a four-year low. Granted, August may turn out to be an anomaly. And the six-month buyback trend remains robust. Still, if corporate buybacks really do begin to wane, it will be up to the world’s central banks to foster even more exhilaration for the extremely overvalued asset class.
