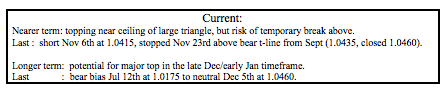
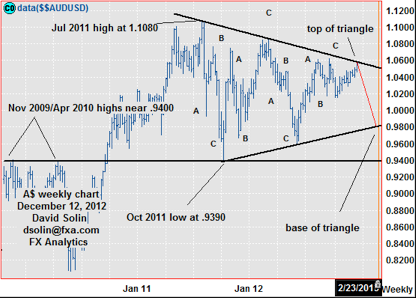
No change in the long held view of upward ranging into the end of Dec, as part of a longer term topping near the ceiling of the triangle/pennant that has been forming since July 2011 (which is indeed occurring). Also, the seasonal chart points higher over the next few weeks (see third chart below), adding to the view of upside pressure into the of the year. Though the market is currently nearing the ceiling, "ideally" will see another few weeks of ranging before the final top is seen (see "ideal" scenario in red on daily chart below). Also, timing in case is more important than a specific level, so would not be looking to short an approach of that ceiling (currently at 1.0590/25) until after the end of the year. A couple of other points, everyone sees and is watching this large triangle pattern and in markets when most have the same view, it tends to be wrong. Additionally, its not uncommon for 1 leg of these patterns to overshoot its trendline (temporarily, false break) and given the widely seen nature of the pattern and another few weeks until the end of the year, such a temporary break is seen more likely than normal (to wash out all the bears). Nearby support is seen at 1.0460/70 and the base of the bull channel from Oct (currently at 1.0370/80).
Strategy/position: Never reached the buy target from the Dec 5th email at 1.0400 before pushing higher. At this point with another week or 2 of topping favored (and the market nearing the key ceiling of the large triangle), its not seen as the time to chase. So can trade with a very short term bias (too short for these emails), looking to fade extremes and being aggressive with stops (to maintain a good risk/reward reward), but with the expectation of a bigger picture chance to short a few weeks ahead.
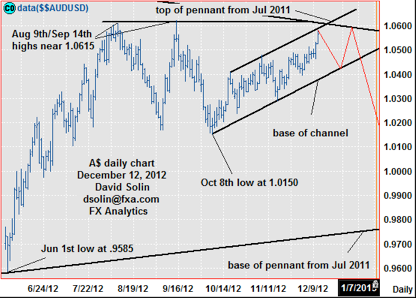
- Long-Term OutlookLong held view of a large triangle/pennant forming since July 2011 remains in place, and with eventual declines to the base (currently at .9725/50) and potentially below favored. Note too the series of 3 wave moves in both directions (A-B-C's, see weekly chart/second below), adds to this view, as these patterns break down to a series of 5, 3 wave moves. Also as discussed above, even a break above the ceiling would not abort this view as such a move (if it does indeed occur) may only be a false/temporary break.
With another few weeks of topping (and potentially even a temp break above the ceiling), would maintain the longer term neutral bias (but also with the expectation switching the longer term bias to bearish a few weeks ahead).