
The JPY weakening accelerated violently. Developments are JPY bearish – but this move may be going too far, too fast. Meanwhile, Aussie is weaker on RBA’s accumulation of foreign currency.
The pounding of the JPY continues on Japanese political developments as the assumption is that the opposition LDP's Abe, once he likely assumes wins next month's elections, will be far more aggressive in moving to ease policy and force the JPY weaker, even trampling on the BoJ's principle of independence to get his way.
Another angle entirely is the China/Japanese relations issue, which some are speculating could take a further dive after the islands dispute because of past visits several years ago by Abe to a Japanese shrine honouring Japanese war dead which is very controversial in South Korea and China. But Abe has also spoken in favour of better diplomatic relations with the Chinese, though he also very recently voiced criticism of Chinese policy on Tibet.
All in all, it's an extra risk to bear in mind as we also wait for the data that shows how deep the popular boycott in China of Japanese goods is proving (trade data is up next week). Again, another interesting thing going on here is the recent separation of this JPY move from the move in global sovereign bond yields – see the EUR/JPY vs. German Bunds example below. We are either heading for a paradigm shift here as we’re heading toward a whole new level of intervention from the Japanese authorities or this is a bit of a false dawn.
I would suggest that as long as bond yields remain this low, particularly if risk appetite is also poor, the JPY weakening may occur in very fitful three steps weaker, two steps stronger fashion, but let’s see how the currency does on another round of risk aversion. Note that USD/JPY took out a very key level at 81.00 today, which was a major Ichimoku level on the weekly charts. Let’s see where we close this week.
Chart: EUR/JPY vs. German Bund yield
Note how the recent JPY weakening shows the most significant divergence from the moves in the yields in recent history. The coming days/weeks tell us whether we are in a new paradigm or whether the gravity of rate spread logic reasserts (there is also the difficulty of having to calculate relative central bank balance sheet expansion/competitive devaluation rather than merely rate spreads, making things a bit less straightforward. On this account, it would mean the ECB needs to move deeper into QE to see the gap closed if Abe’s bite on BoJ easing is as severe as his bark.
FOMC Minutes
There were two ways to read the FOMC minutes – on the one hand, we had the mention of a possible replacement of Operation Twist at the beginning of the new year looking more like an expansion of QE3, but on the other hand, some see the vigorousness of the debate on whether this is necessary as a sign that the automatic reach for ever more easing is not necessarily.
The muted reaction suggests this wasn’t much of a development – and it also suggests some degree of exhaustion on speculating about Fed easing – though one can’t help believe that the Japan distraction at the moment is a significant reason behind the lack of focus on these rather interesting minutes – also as we have this new debate sparked by Yellen comments earlier this week and alson in last night’s minutes on whether the Fed will tie rate moves to explicit economic data levels. (Silly, as this would amplify market risk on data releases).
Weak Aussie
The Aussie was sharply weaker as the Australian FX reserves data shows that the RBA is passively accumulating foreign currency reserves rather than buying AUD to offset foreign purchases - to the tune of almost half a billion USD in October - and this knocked the legs out from under the broad AUD rally, as the currency was lower versus almost everything save for the JPY today.
As well, the forward interest rate curve showed a stronger tendency to predict RBA cuts to the tune of about -5-6 bps for the next 12 months as this was perhaps also seen as a wider sign that the RBA is getting upset with the strong Aussie. In AUD/USD, the 200-day moving average is suddenly back into view at 1.0325 – where it is trading as of this writing after a brief try lower. Note that a fairly major rising trendline is also in play in AUD/USD.
Chart: AUD/USD
Note the trend line in play and the 200-day moving average.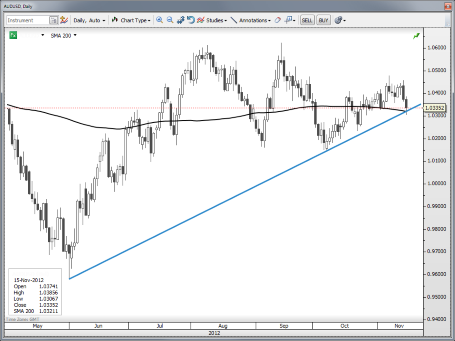 AUD/USD" title="AUD/USD" width="455" height="341">
US Data
The US jobless claims data spiked massively to the upside, no surprise given the storm hitting the most populous area of the US a couple of weeks back. Hurricane Katrina saw about a six-week disturbance in the data series, so we might not be able to tell much about the real state of the job market until the very end of the year, which is unfortunate, as this is a critical season for the job market, which traditional sheds the most jobs from October to January. Other data in the US: CPI data was not interesting, but the terrible Philly Fed was certainly an outlier.
Looking ahead
Look out for Bernanke up speaking later today. Tomorrow we have the SNB’s Jordan out speaking at a conference and US industrial production/capacity utilization data for October. In the charts, we have this 81.00 area in USD/JPY and whether we close the week above there, as well as the 200-day moving average in EUR/USD just above 1.2800 as a key resistance line in the sand.
Economic Data Highlights
- New Zealand Nov. ANZ Consumer Confidence out at 114.1 vs. 110.5 in Oct.
- Germany GDP rose +0.2% QoQ and +0.9% YoY vs. +0.1%/+0.8% expected, respectively and vs. +1.0% YoY in Q2
- Sweden October Unemployment Rate out at 7.7% vs. 7.9% expected and 7.8% in Sep.
- Norway October Trade Balance out at NOK +31.8B vs. NOK +23.6B in Sep.
- UK October Retail Sales ex Auto Fuel out at -0.7% MoM and +1.1% YoY vs. -0.1%/+2.1% expected, respectively and vs. +2.7% YoY in September
- Eurozone October CPI out at +0.2% MoM and +2.5% YoY as expected and vs. +2.5% YoY in September
- Eurozone Q3 GDP out at -0.1% QoQ and -0.6% YoY as expected and vs. -0.4% YoY in Q2
- Canada September Manufacturing Sales out at +0.4% MoM vs. +0.3% expected
- US October CPI out at +0.1% MoM and +2.2% YoY vs. +0.1%/+2.1% expected, respectively and vs. +2.0% YoY in September
- US October CPI ex Food and Energy out at +0.2% MoM and +2.0% YoY vs. +0.1%/+2.0% expected, respectively and vs. +2.0% YoY in September
- US November Empire Manufacturing out at -5.22 vs. -8.0 expected and -6.16 in October
- US Weekly Initial Jobless Claims out at 439k vs. 375k expected and 361k last week
- US Weekly Continuing Claims out at 3334k vs. 3181k expected and 3163k last week
- Canada October Existing Home Sales fell -0.1% MoM
- US Weekly Bloomberg Consumer Comfort Index rose to -33.1 vs. -34.4 last week
- US November Philly Fed out at -10.7 vs. +2.0 expected and +5.7 in October
- US Weekly DoE Crude Oil and Product Inventories (1600)
- US Fed’s Bernanke to Speak on Housing/Mortgage Market (1820)
- US Fed’s Krieger to Speak (1830)
- US Fed’s Fisher to Speak (1945)
- US Fed’s Plosser to Speak (2130)