So the bears have spoken – AUD/USD tanked spectacularly after hitting the 0.93 resistance yesterday. Price rallied from the low of 0.910 due to Bernanke’s dovish talk on Wednesday, which sent USD weaker and AUD/USD much higher. However, it is clear that USD weakness is no match for bearish sentiment surrounding AUD, with expectations for RBA rate cut in August increasing by the day. Today added further scope for potential RBA rate cut, with the latest Home Loans data coming in at 1.8% vs an expected 2.2%, suggesting that the housing market will have a lower risk of bubbling should RBA cut rate again. Not that RBA will need this extra scope, as they have been repeating ad nauseam in every single rate meeting that current inflation rate/expectation allow RBA to cut rates if they wanted to.
Some may say that the decline yesterday was due to the strengthening of USD following strong showing of US stocks which led to record S&P 500 close. That is only partially accurate though, as it is clear that bearish sentiment in AUD is stronger than other risk currencies when we look at EUR/USD and GBP/USD, where the pullback wasn’t as strong as AUD/USD, with price barely giving up 50% of the gains made post FOMC minutes. The fact that the huge turnaround started from 0.93 significant resistance suggest that there are huge predatory bears looking for good opportunities to sell at key price points, with the rest of the opportunistic speculators helping to push price lower to where we are now.
Hourly Chart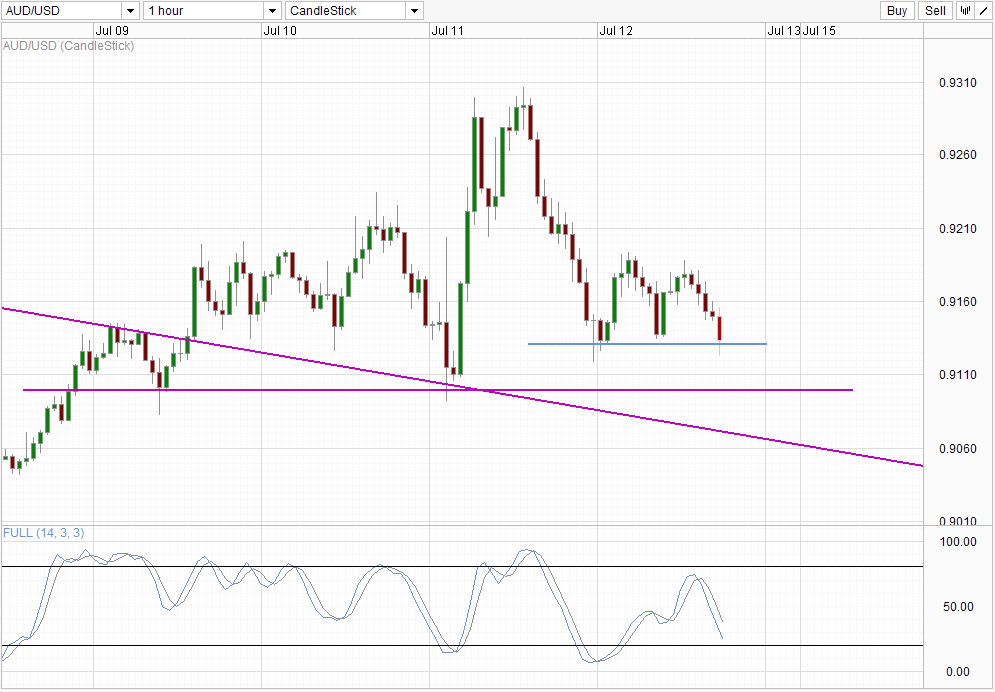 AUD/USD 1" width="580" height="403">
Currently, we are being supported by the intraday support of 0.913. Given the strong bearish pressure that was described above, and the fact that stochastic readings are still above the Oversold region, it is possible that price may be able to break the weak intraday support to find stronger support around 0.910 and potentially the descending trendline.
Daily Chart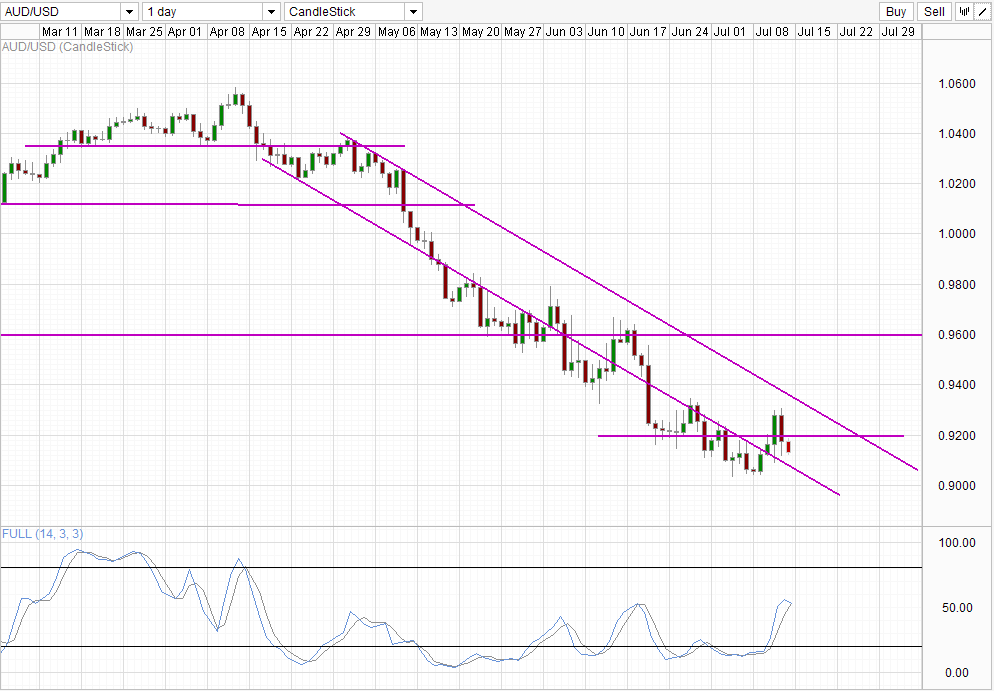 AUD/USD 2" width="580" height="403">
Looking at price action from the Daily Chart perspective, we can’t really say that we’re surprised that a tweezer top has formed. Price has failed to hit Channel Top ever since May and the previous 2 attempts to break within the Channel has failed miserably. Looking at how price has reacted in the past, Channel Bottom does not really provide support for price action, with price breaking below the Channel Bottom with ease, and only using the line for resistance reference. With this in mind, do not be surprise to see price breaking below Channel Bottom especially since a reversal pattern has been formed. Furthermore, Stochastic readings suggest that a bear cycle may be forming soon with Stoch lines looking to close below the Signal line. Considering that there is a divergence between Price peaks and recent higher stock peaks, this bearish cycle signal may be strong as it implies that recent rally activities have been much more overbought compared to before.
Original post
- English (UK)
- English (India)
- English (Canada)
- English (Australia)
- English (South Africa)
- English (Philippines)
- English (Nigeria)
- Deutsch
- Español (España)
- Español (México)
- Français
- Italiano
- Nederlands
- Português (Portugal)
- Polski
- Português (Brasil)
- Русский
- Türkçe
- العربية
- Ελληνικά
- Svenska
- Suomi
- עברית
- 日本語
- 한국어
- 简体中文
- 繁體中文
- Bahasa Indonesia
- Bahasa Melayu
- ไทย
- Tiếng Việt
- हिंदी
AUD/USD: U-Turn Within Descending Channel
Published 07/12/2013, 07:16 AM
Updated 07/09/2023, 06:31 AM
AUD/USD: U-Turn Within Descending Channel
3rd party Ad. Not an offer or recommendation by Investing.com. See disclosure here or
remove ads
.
Latest comments
Install Our App
Risk Disclosure: Trading in financial instruments and/or cryptocurrencies involves high risks including the risk of losing some, or all, of your investment amount, and may not be suitable for all investors. Prices of cryptocurrencies are extremely volatile and may be affected by external factors such as financial, regulatory or political events. Trading on margin increases the financial risks.
Before deciding to trade in financial instrument or cryptocurrencies you should be fully informed of the risks and costs associated with trading the financial markets, carefully consider your investment objectives, level of experience, and risk appetite, and seek professional advice where needed.
Fusion Media would like to remind you that the data contained in this website is not necessarily real-time nor accurate. The data and prices on the website are not necessarily provided by any market or exchange, but may be provided by market makers, and so prices may not be accurate and may differ from the actual price at any given market, meaning prices are indicative and not appropriate for trading purposes. Fusion Media and any provider of the data contained in this website will not accept liability for any loss or damage as a result of your trading, or your reliance on the information contained within this website.
It is prohibited to use, store, reproduce, display, modify, transmit or distribute the data contained in this website without the explicit prior written permission of Fusion Media and/or the data provider. All intellectual property rights are reserved by the providers and/or the exchange providing the data contained in this website.
Fusion Media may be compensated by the advertisers that appear on the website, based on your interaction with the advertisements or advertisers.
© 2007-2024 - Fusion Media Limited. All Rights Reserved.